Day 09
Tuesday, Feb 28, 2017
Contents
Ch 3 Fourier Series
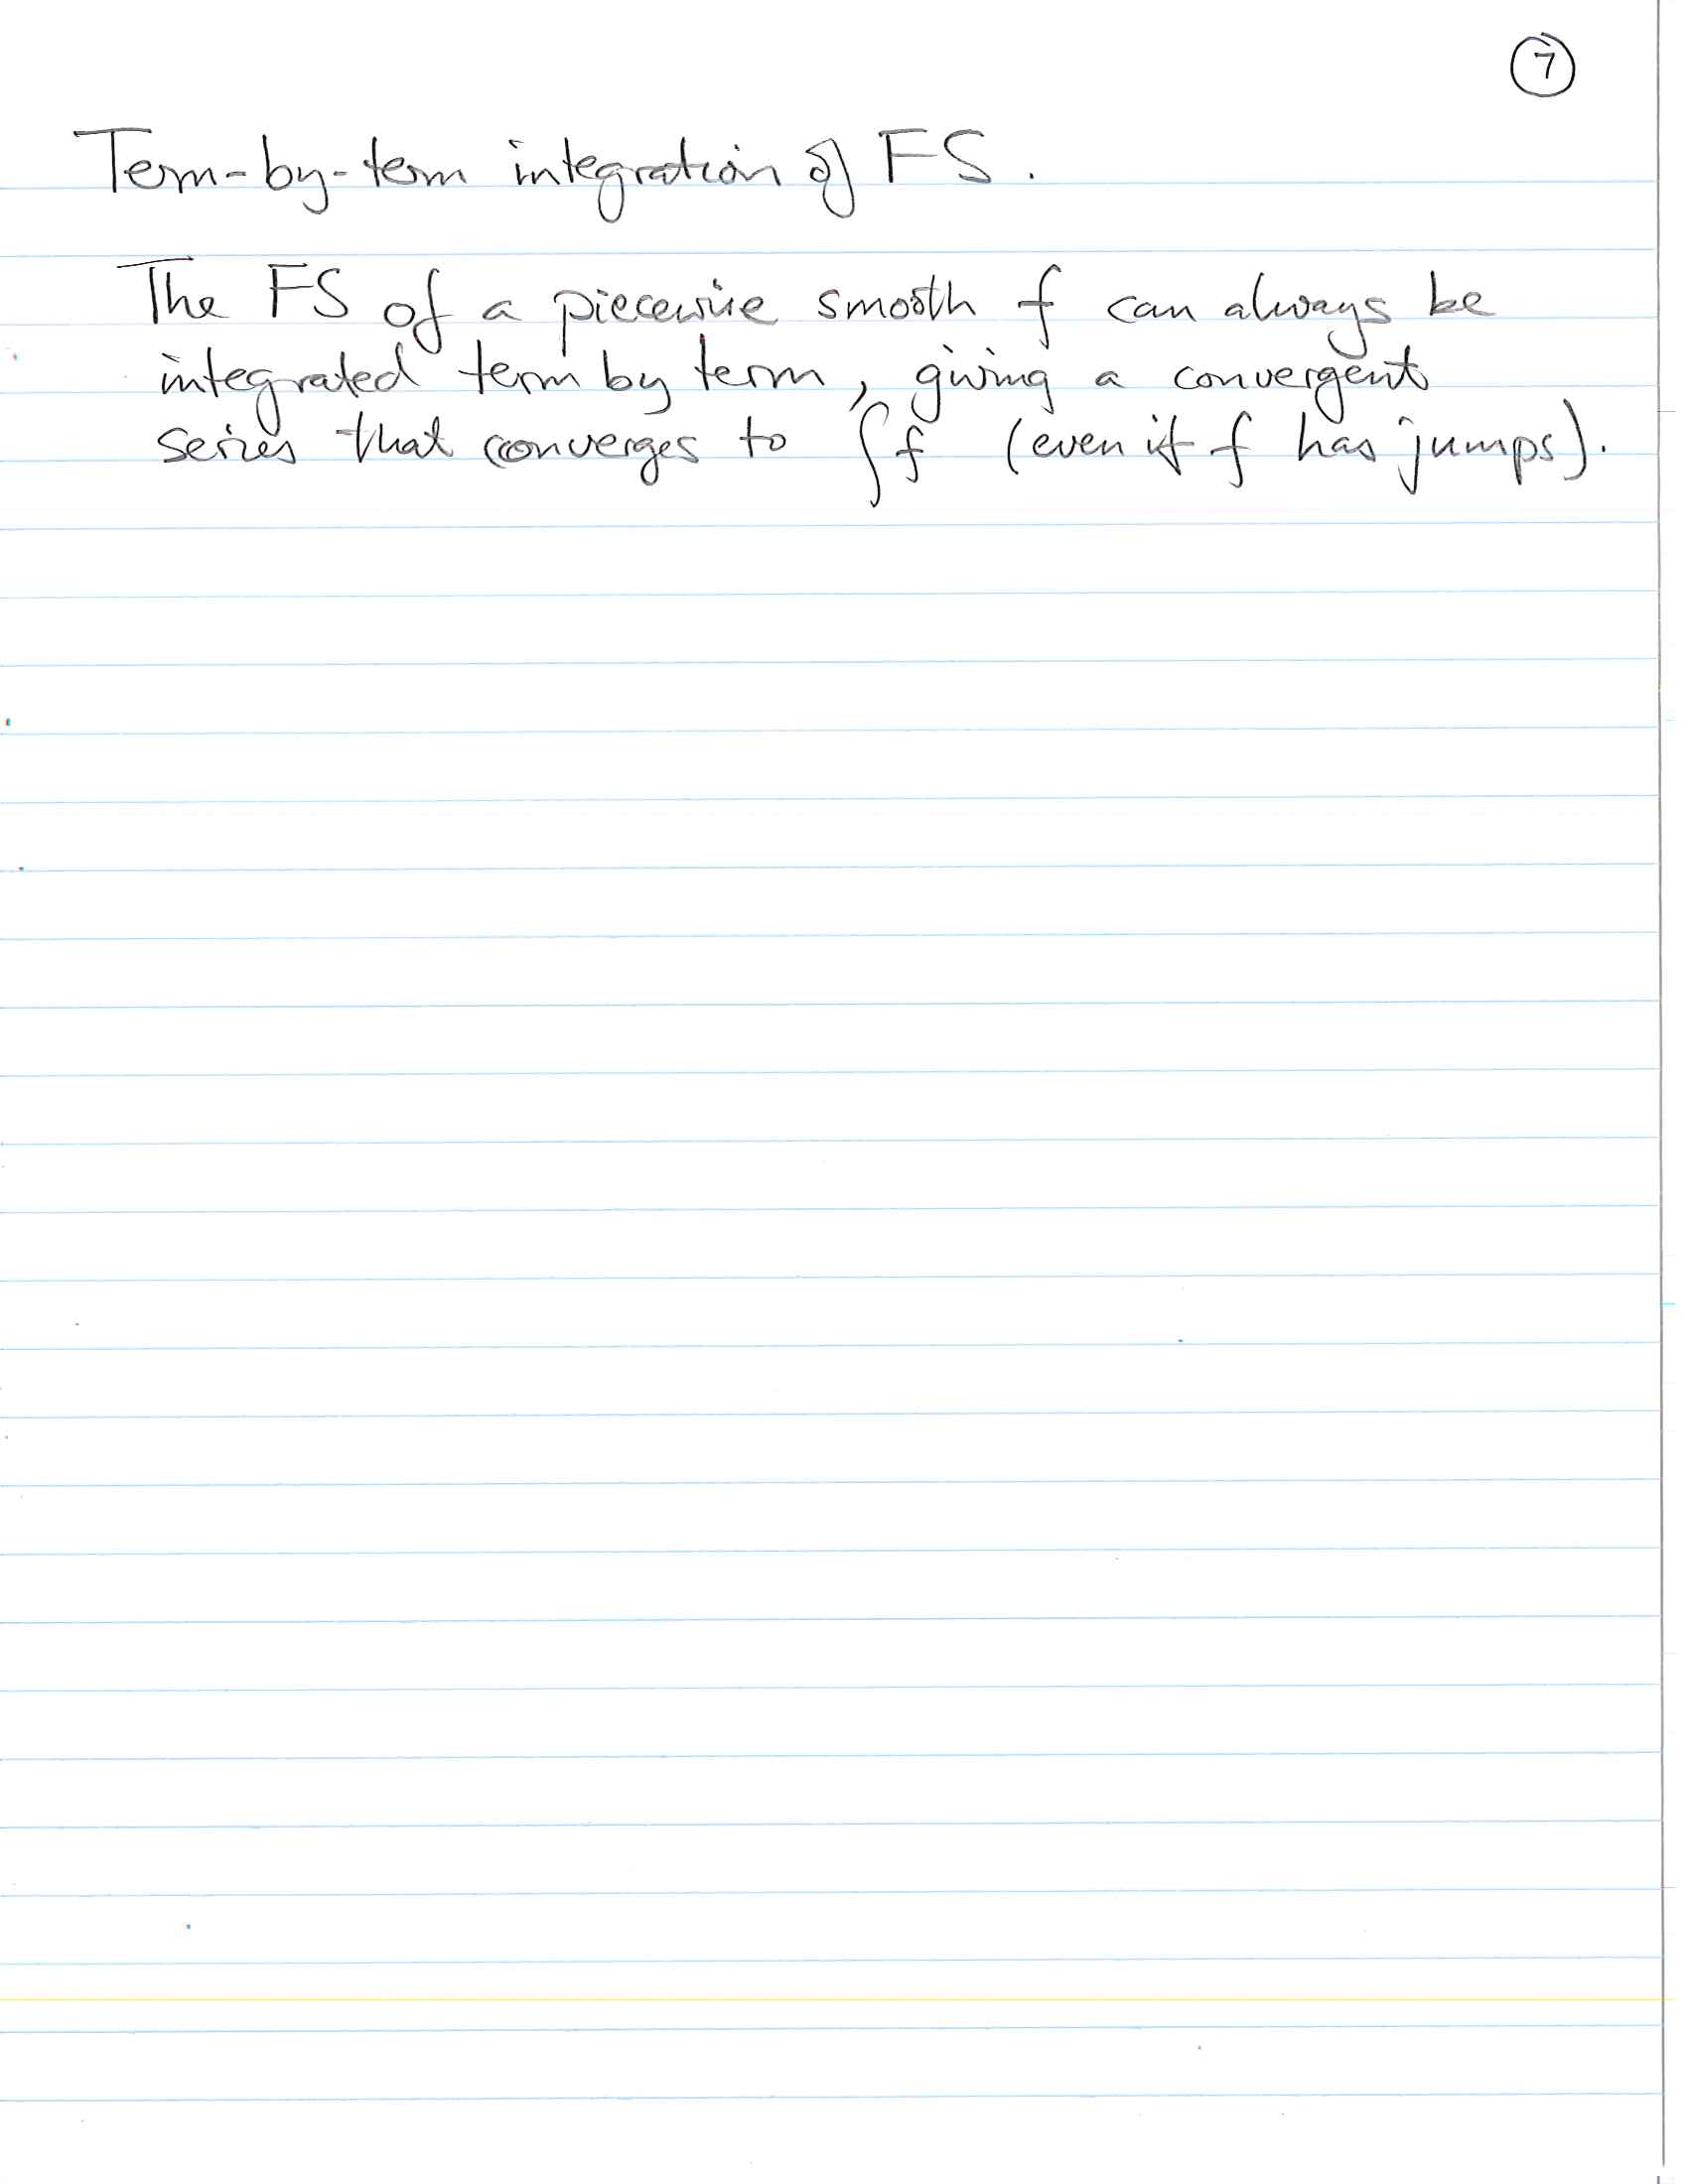
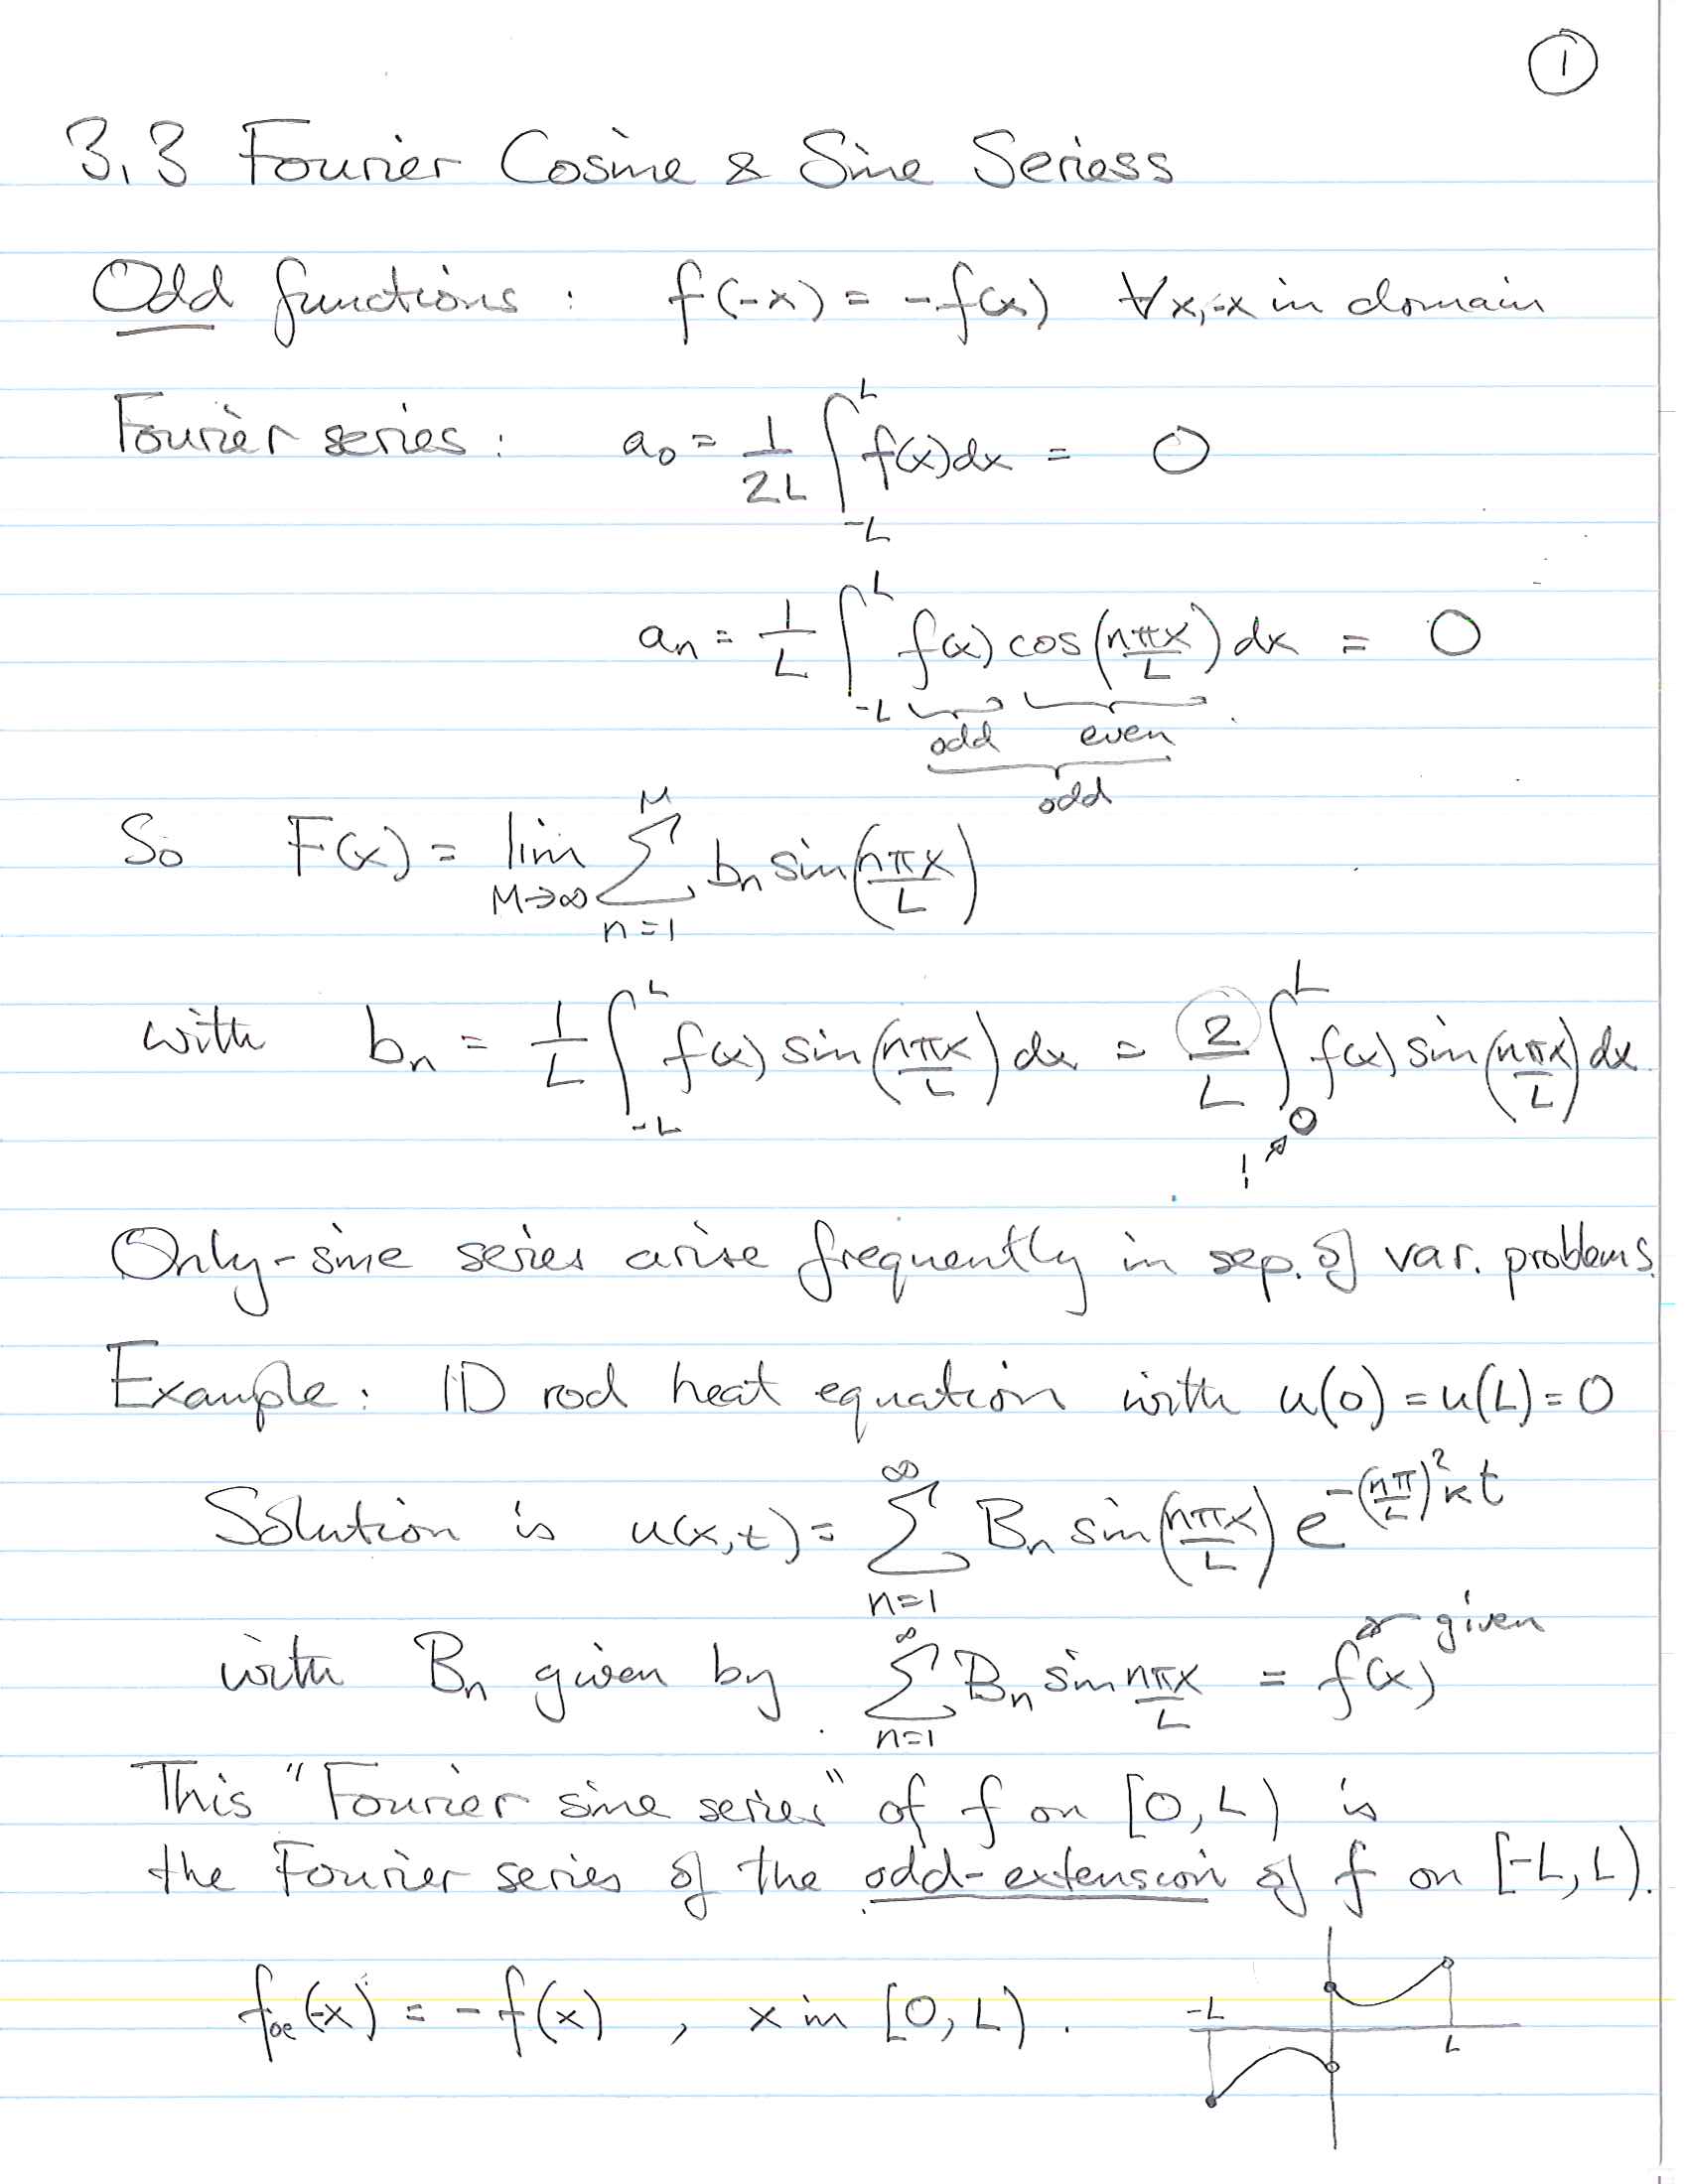
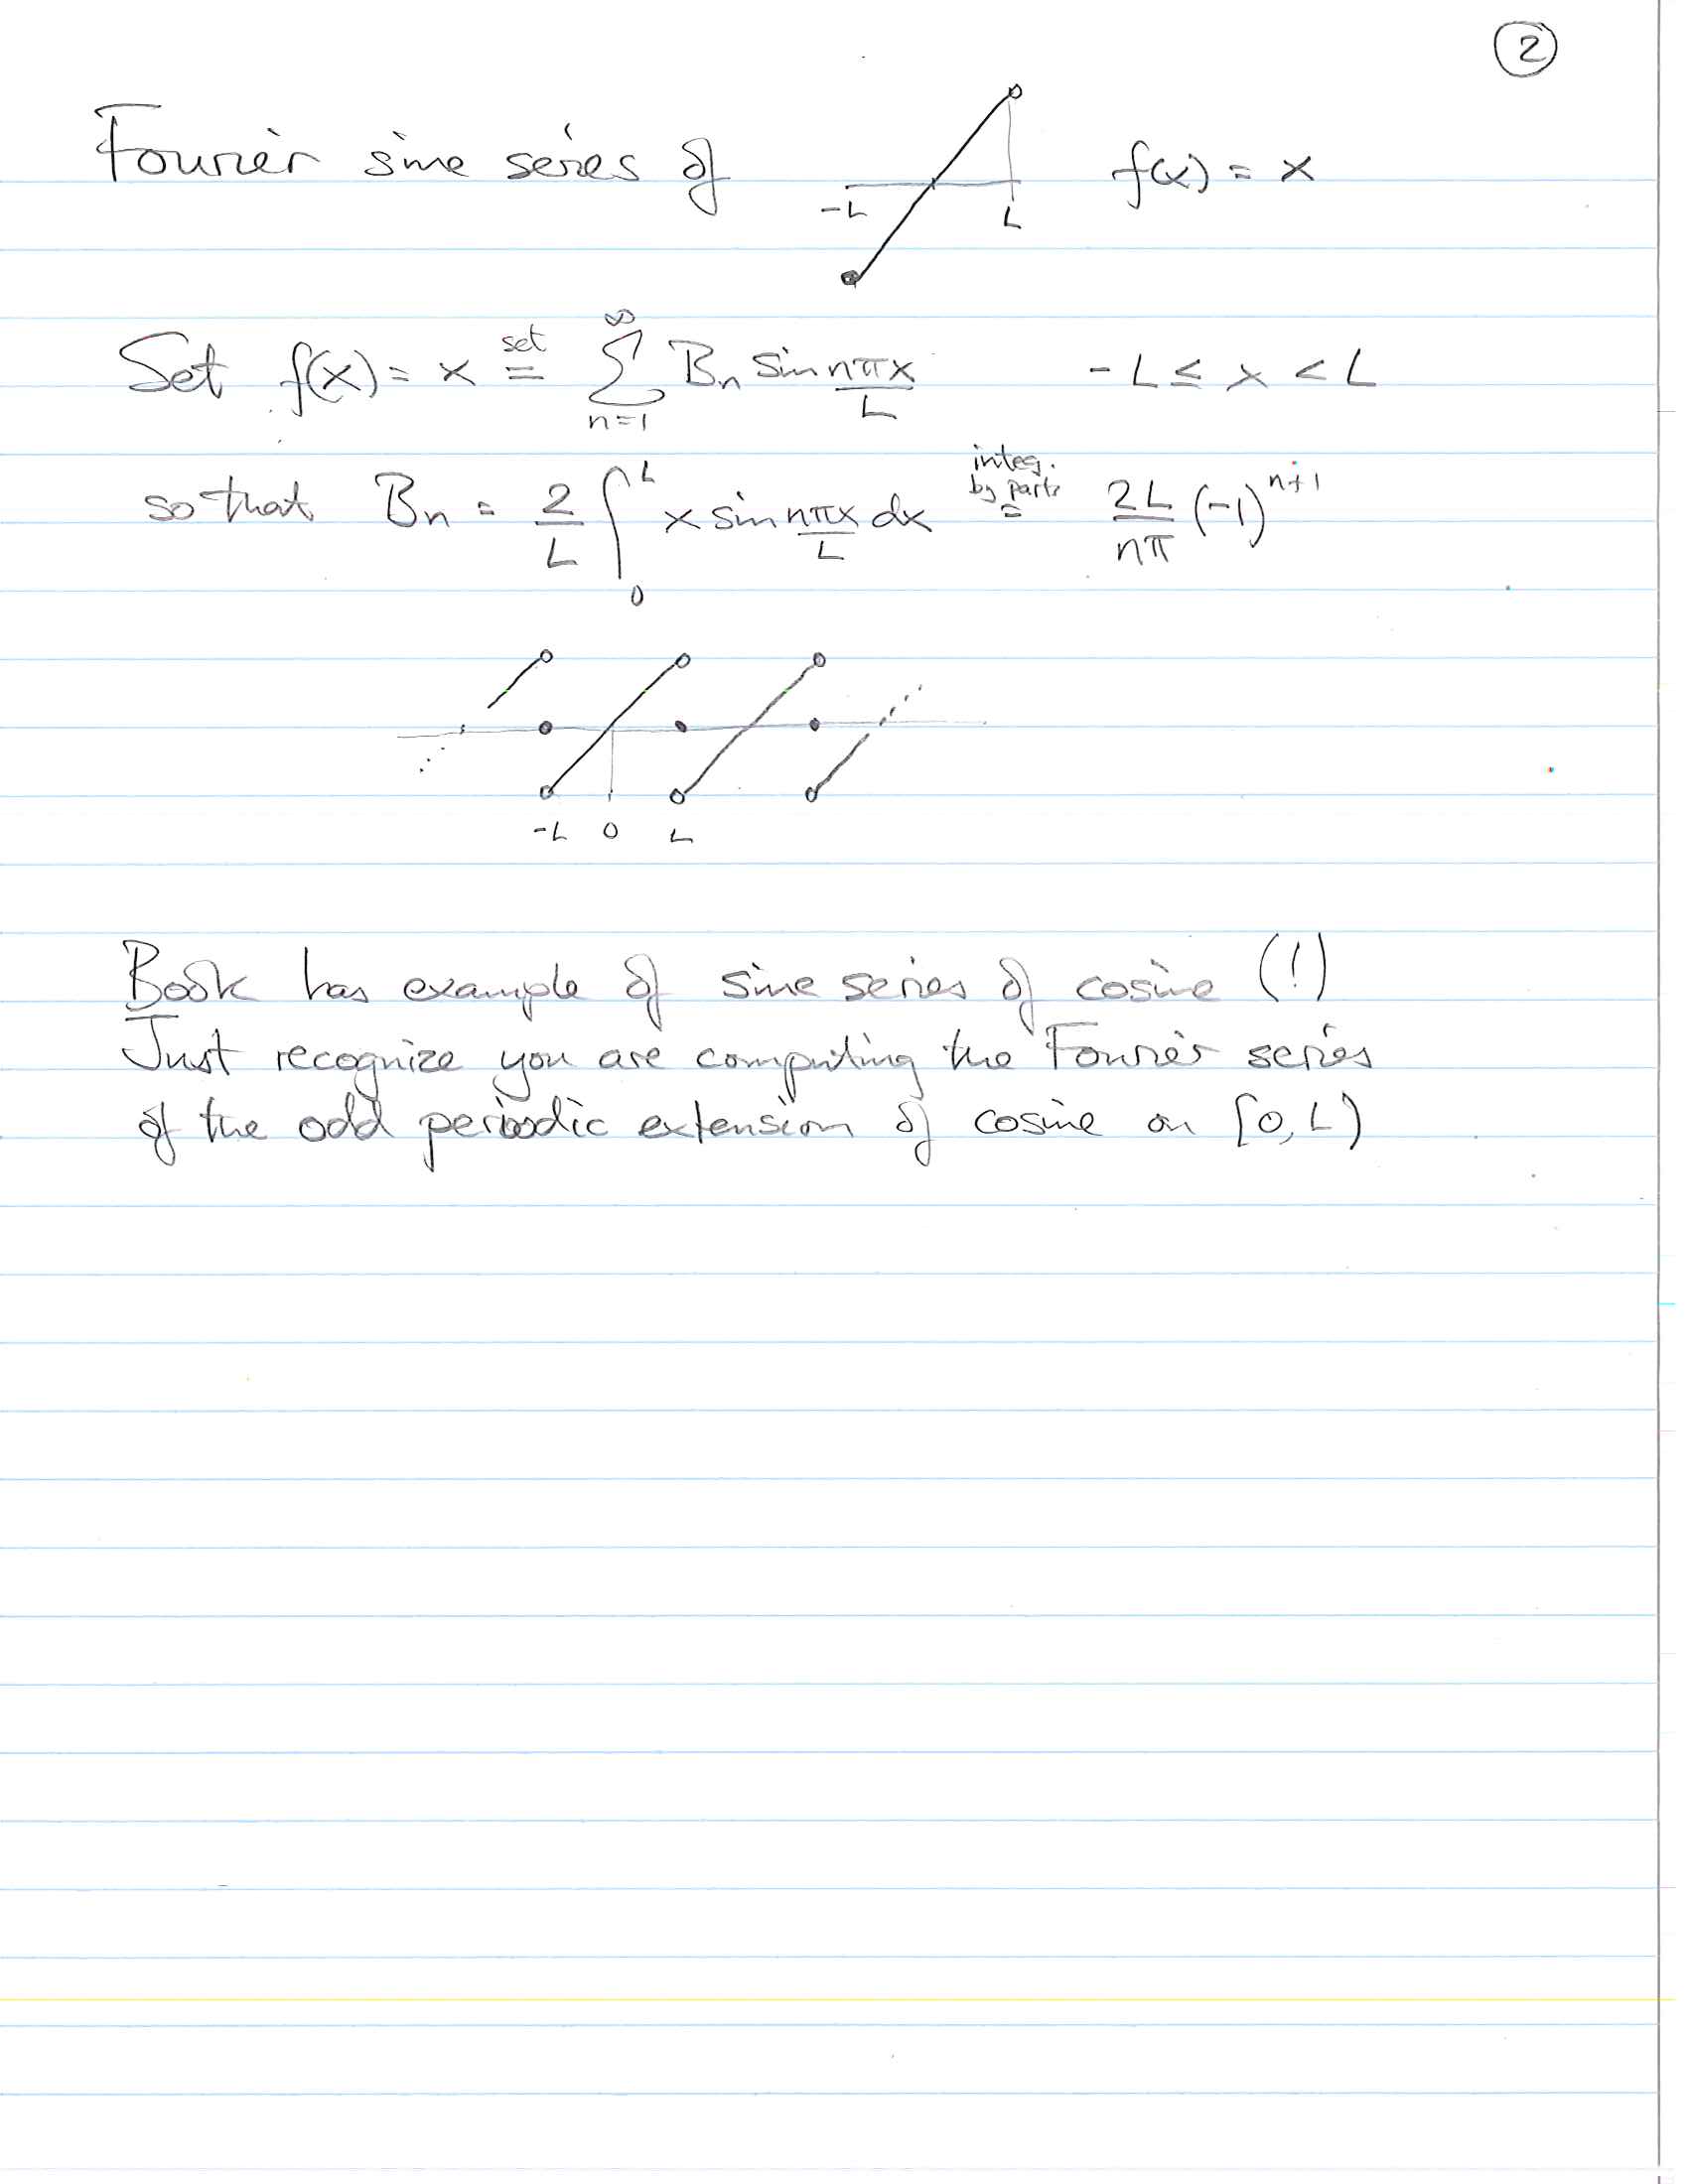
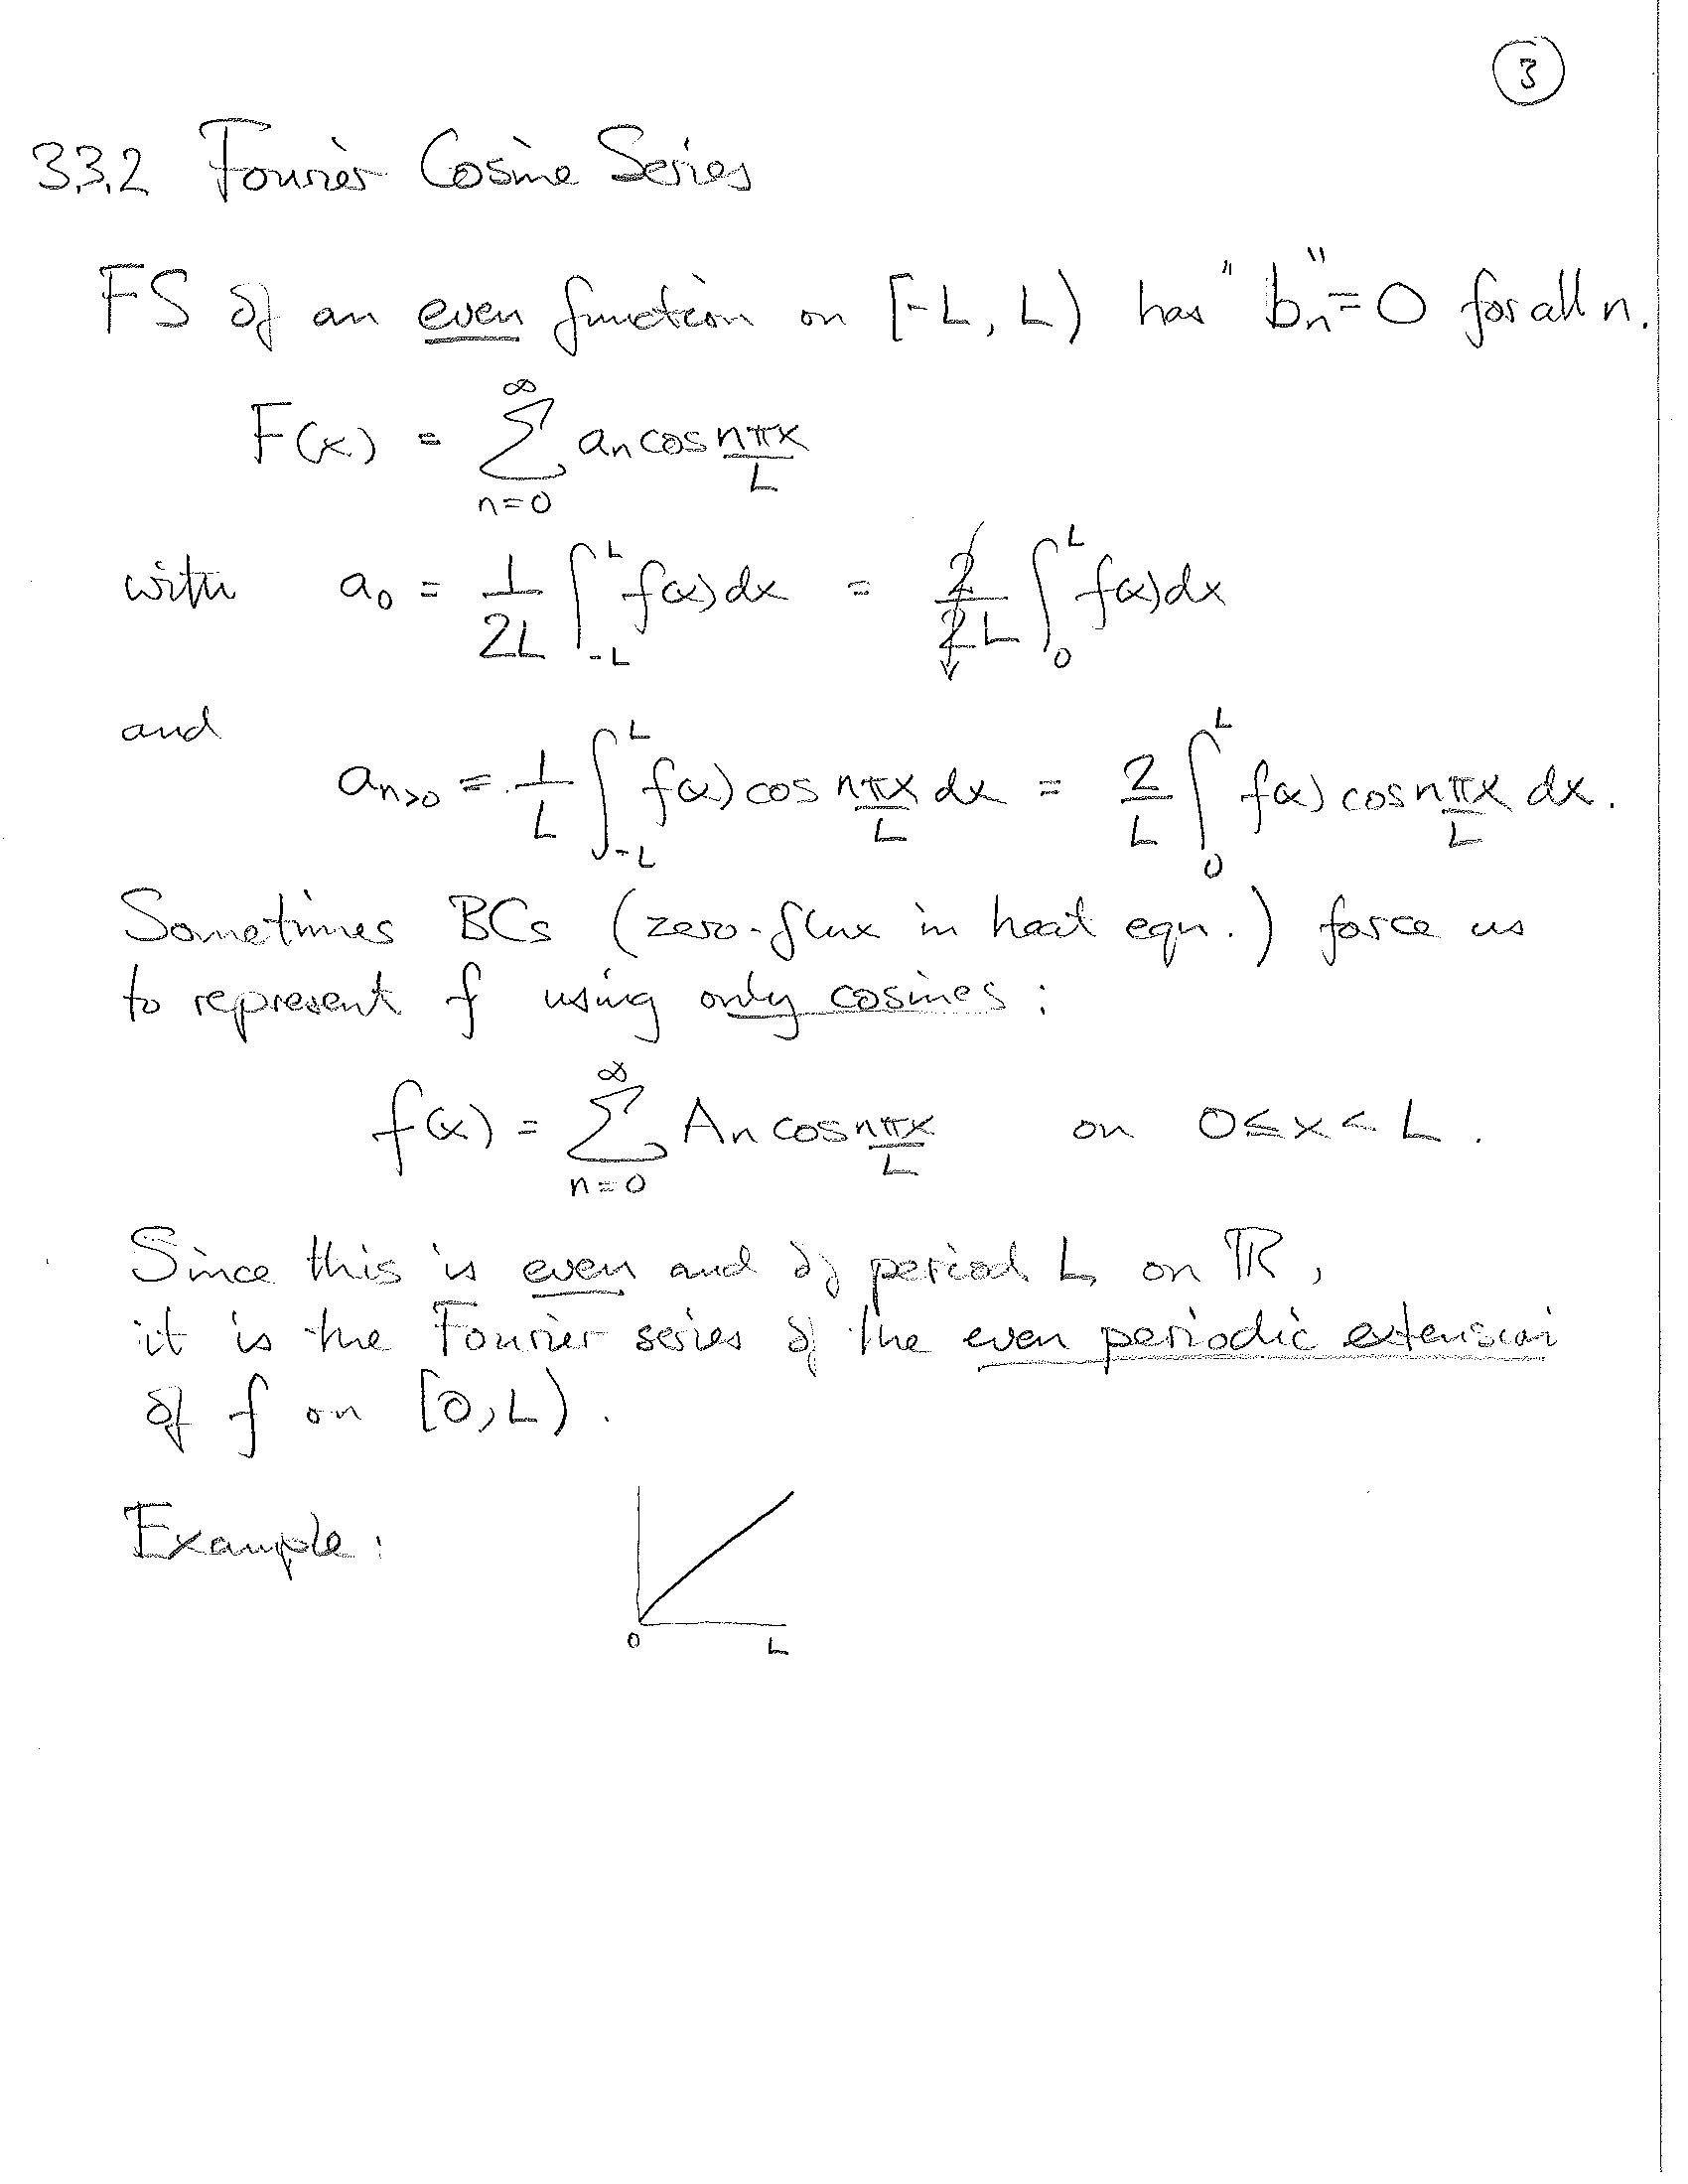
Fourier sine series and cosine series
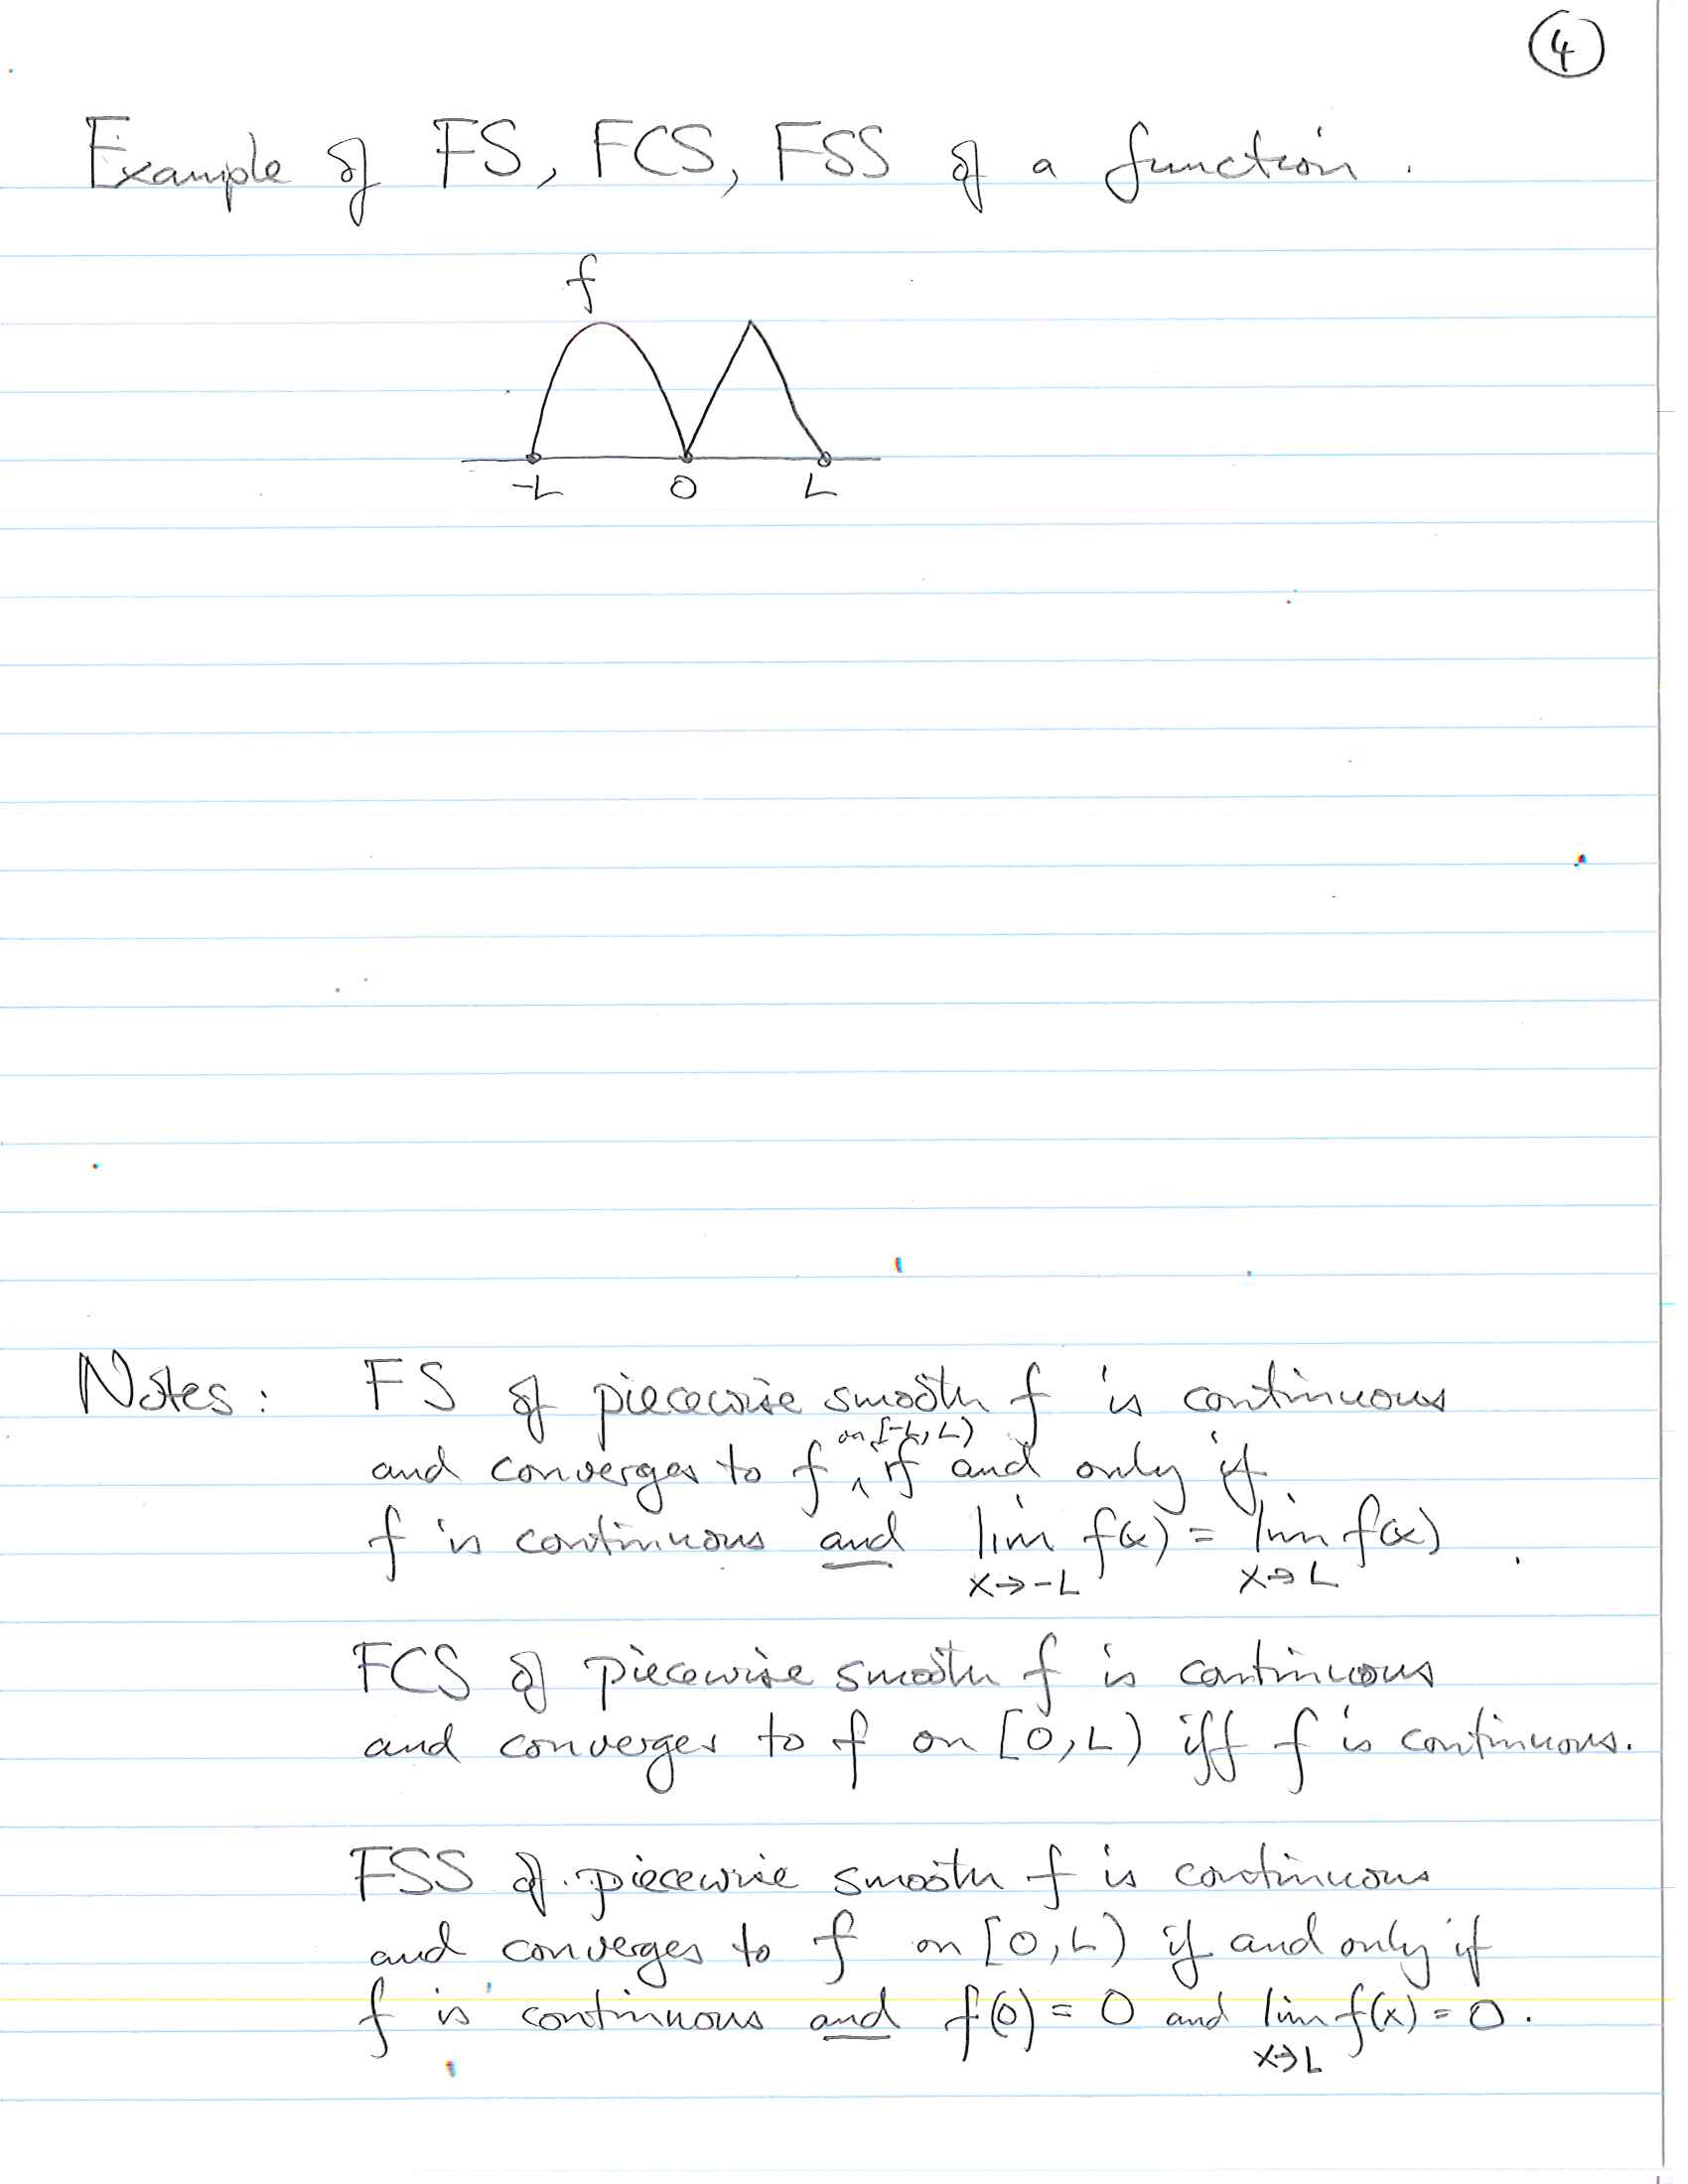
Some examples plotted
%matplotlib inline
import matplotlib.pyplot as pl
from numpy import *
from scipy.integrate import quadrature

def fcs(x,m):
         def ai(x,n): return f(x)*cos(n*pi*x/L)
         a0 = quadrature(ai,0,L,args=(0))[0]/L
         def a(n): return quadrature(ai,0,L,args=(n))[0]*2/L
         return a0 + array([a(n)*cos(n*pi*x/L) for n in range(1,m+1)]).sum(axis=0)

def fss(x,m):
         def bi(x,n): return f(x)*sin(n*pi*x/L)
         def b(n): return quadrature(bi,0,L,args=(n))[0]*2/L
         return array([b(n)*sin(n*pi*x/L) for n in range(1,m+1)]).sum(axis=0)

def makeplot(filename):
         x = linspace(-2.5*L,2.5*L,1000)
         pl.figure(figsize=(12,4))
         x0L = linspace(0,L,100)
         pl.plot(x0L,f(x0L),'r',lw=4,alpha=0.75,label='f')
         pl.plot(x,x*0,'k',alpha=0.3)
         pl.plot(x,fss(x,50),'g', label='FSS of f')
         pl.plot(x,fcs(x,50),'b', label='FCS of f')
         pl.axvline(0,color='k',alpha=0.3)
         pl.legend()
         pl.savefig(filename)
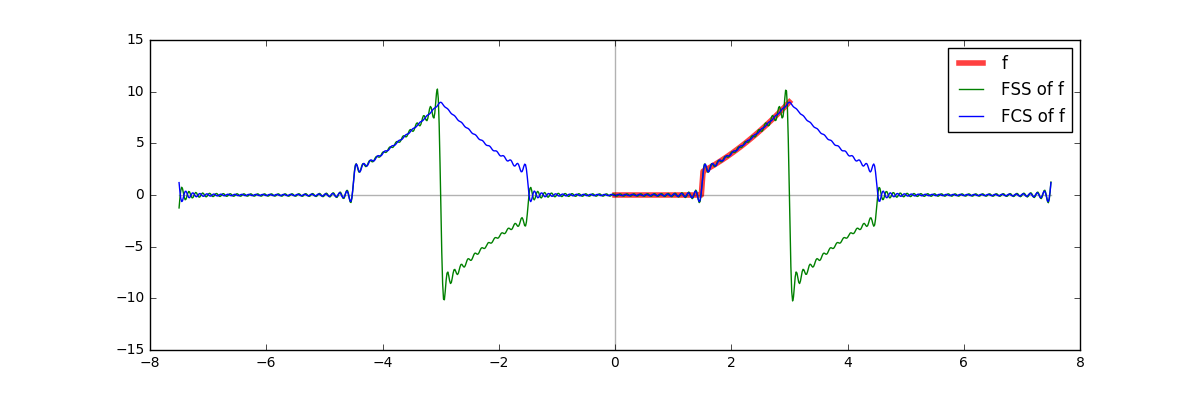
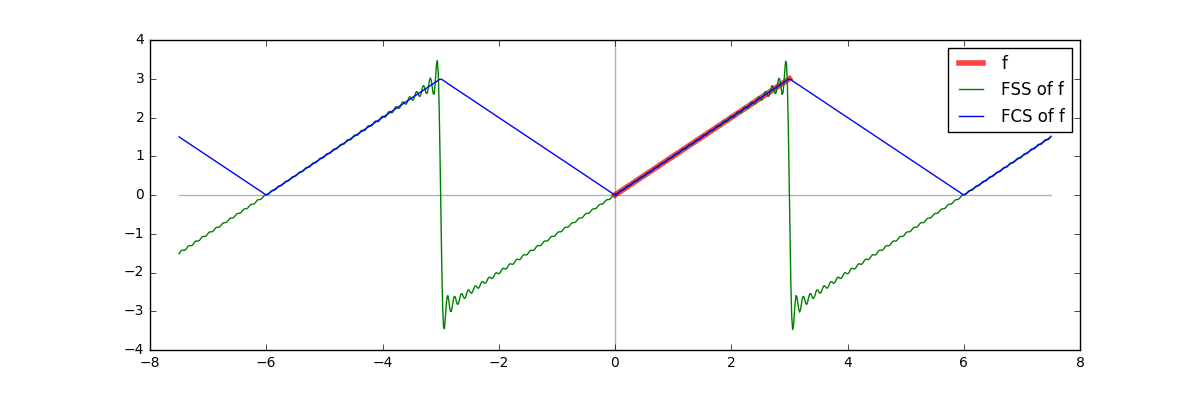
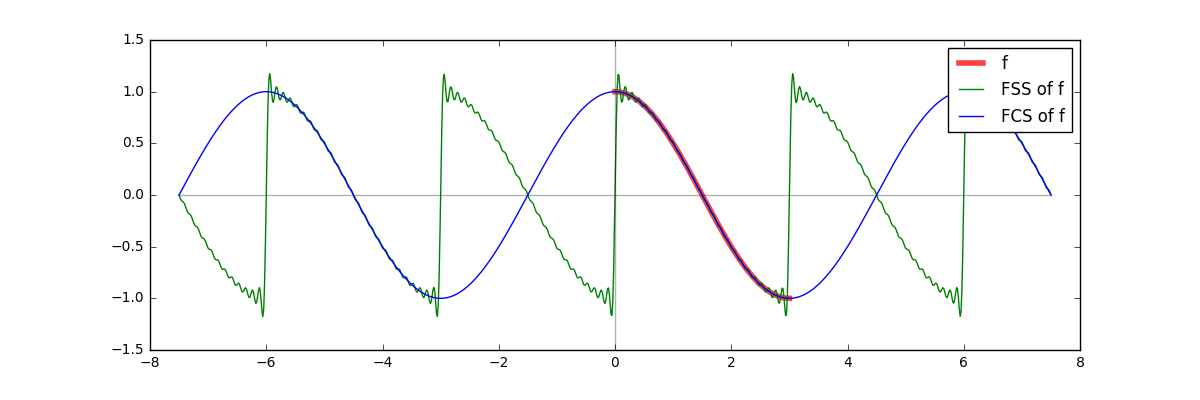
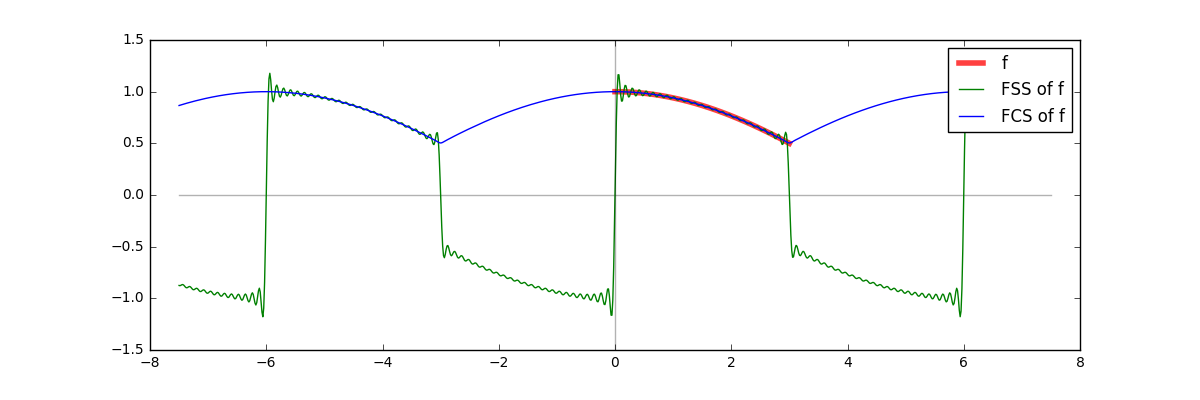
Here I am plotting the partial sums up to n=100 of the FSS and FCS of 3 example functions:
L = 3
def f(x): return x
makeplot('fss_fcs_1.png')
L = 3
def f(x): return cos(pi*x/L)
makeplot('fss_fcs_2.png')
L = 3
def f(x): return cos(pi*x/L/3)
makeplot('fss_fcs_3.png')
L = 3
def f(x):
         fx = x.copy()**2
         fx[ x<L/2 ] = 0
         return fx
makeplot('fss_fcs_4.png')