Day 21
Thursday, April 20, 2017
Sounds and spectra
(from last time in case needed)
This code plots the spectrum of a sound in a wav file: plot_spectrum.py
Example wav files: guitar low E, piano low F, brass bar
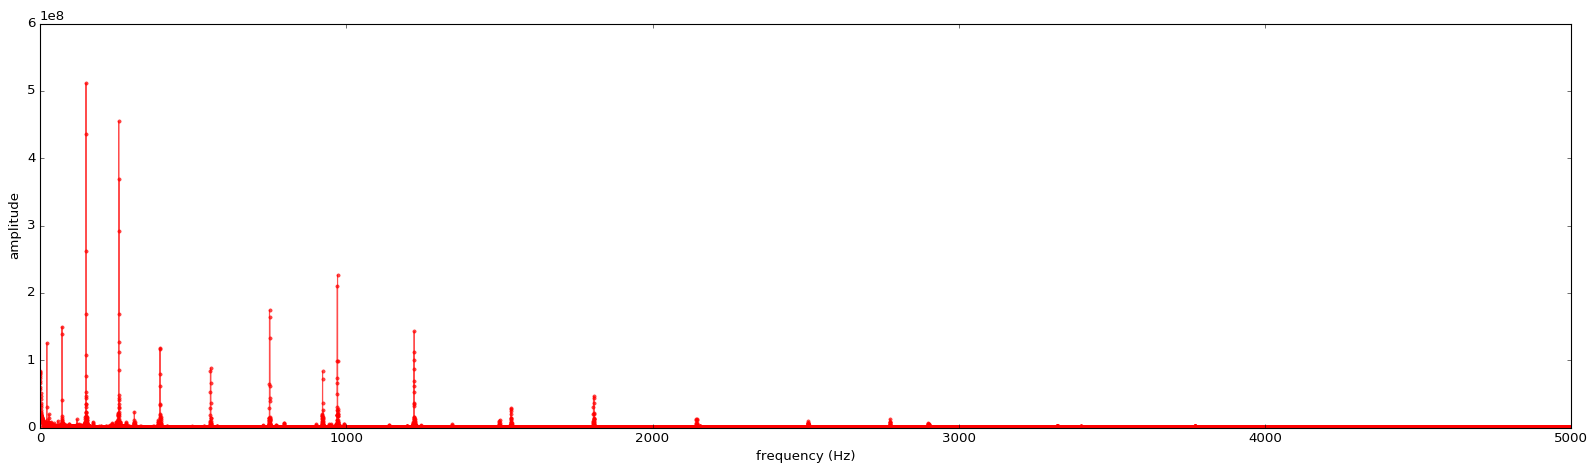
Here is the spectrum of the brass bar:
And here is the spectrum of the low piano note:
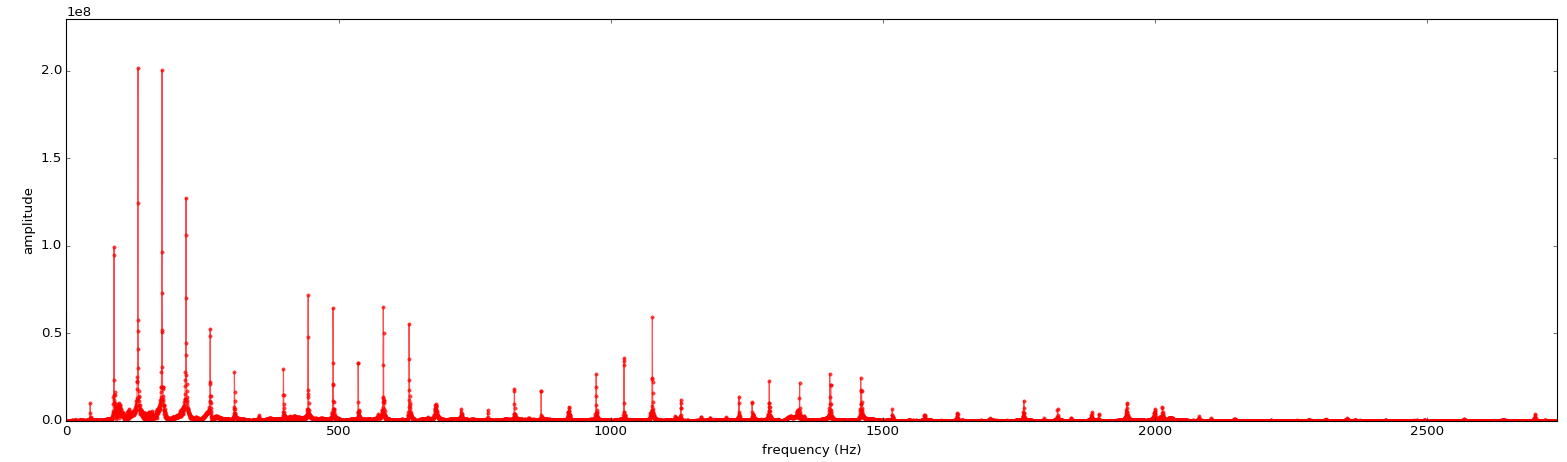
(Notice that the "fundamental" (the lowest frequency) is almost not present.)
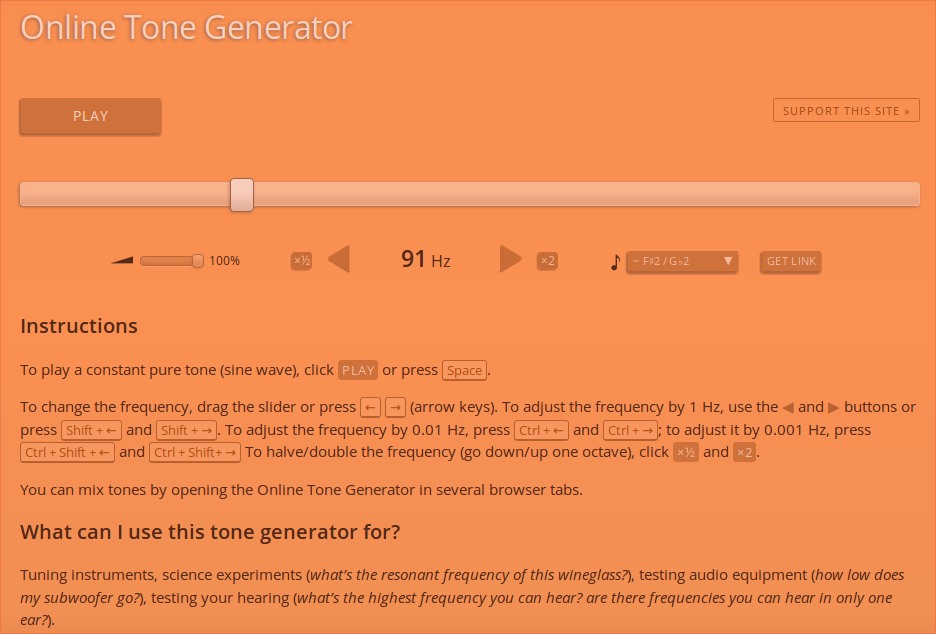
Online tone generator in case it's useful
Synthesis
This code produces a sound with components we specify: replicate_sound.py
Let us see if we can synthesize the recorded brass bar sound above using frequencies and amplitudes read from the spectrum of the recording:
Drum (circular stretched membrane)
Let's record the sound a drum, and analyze and synthesize it.
[In case of difficulties, I prepared these in advance: small tom closed, small tom open]
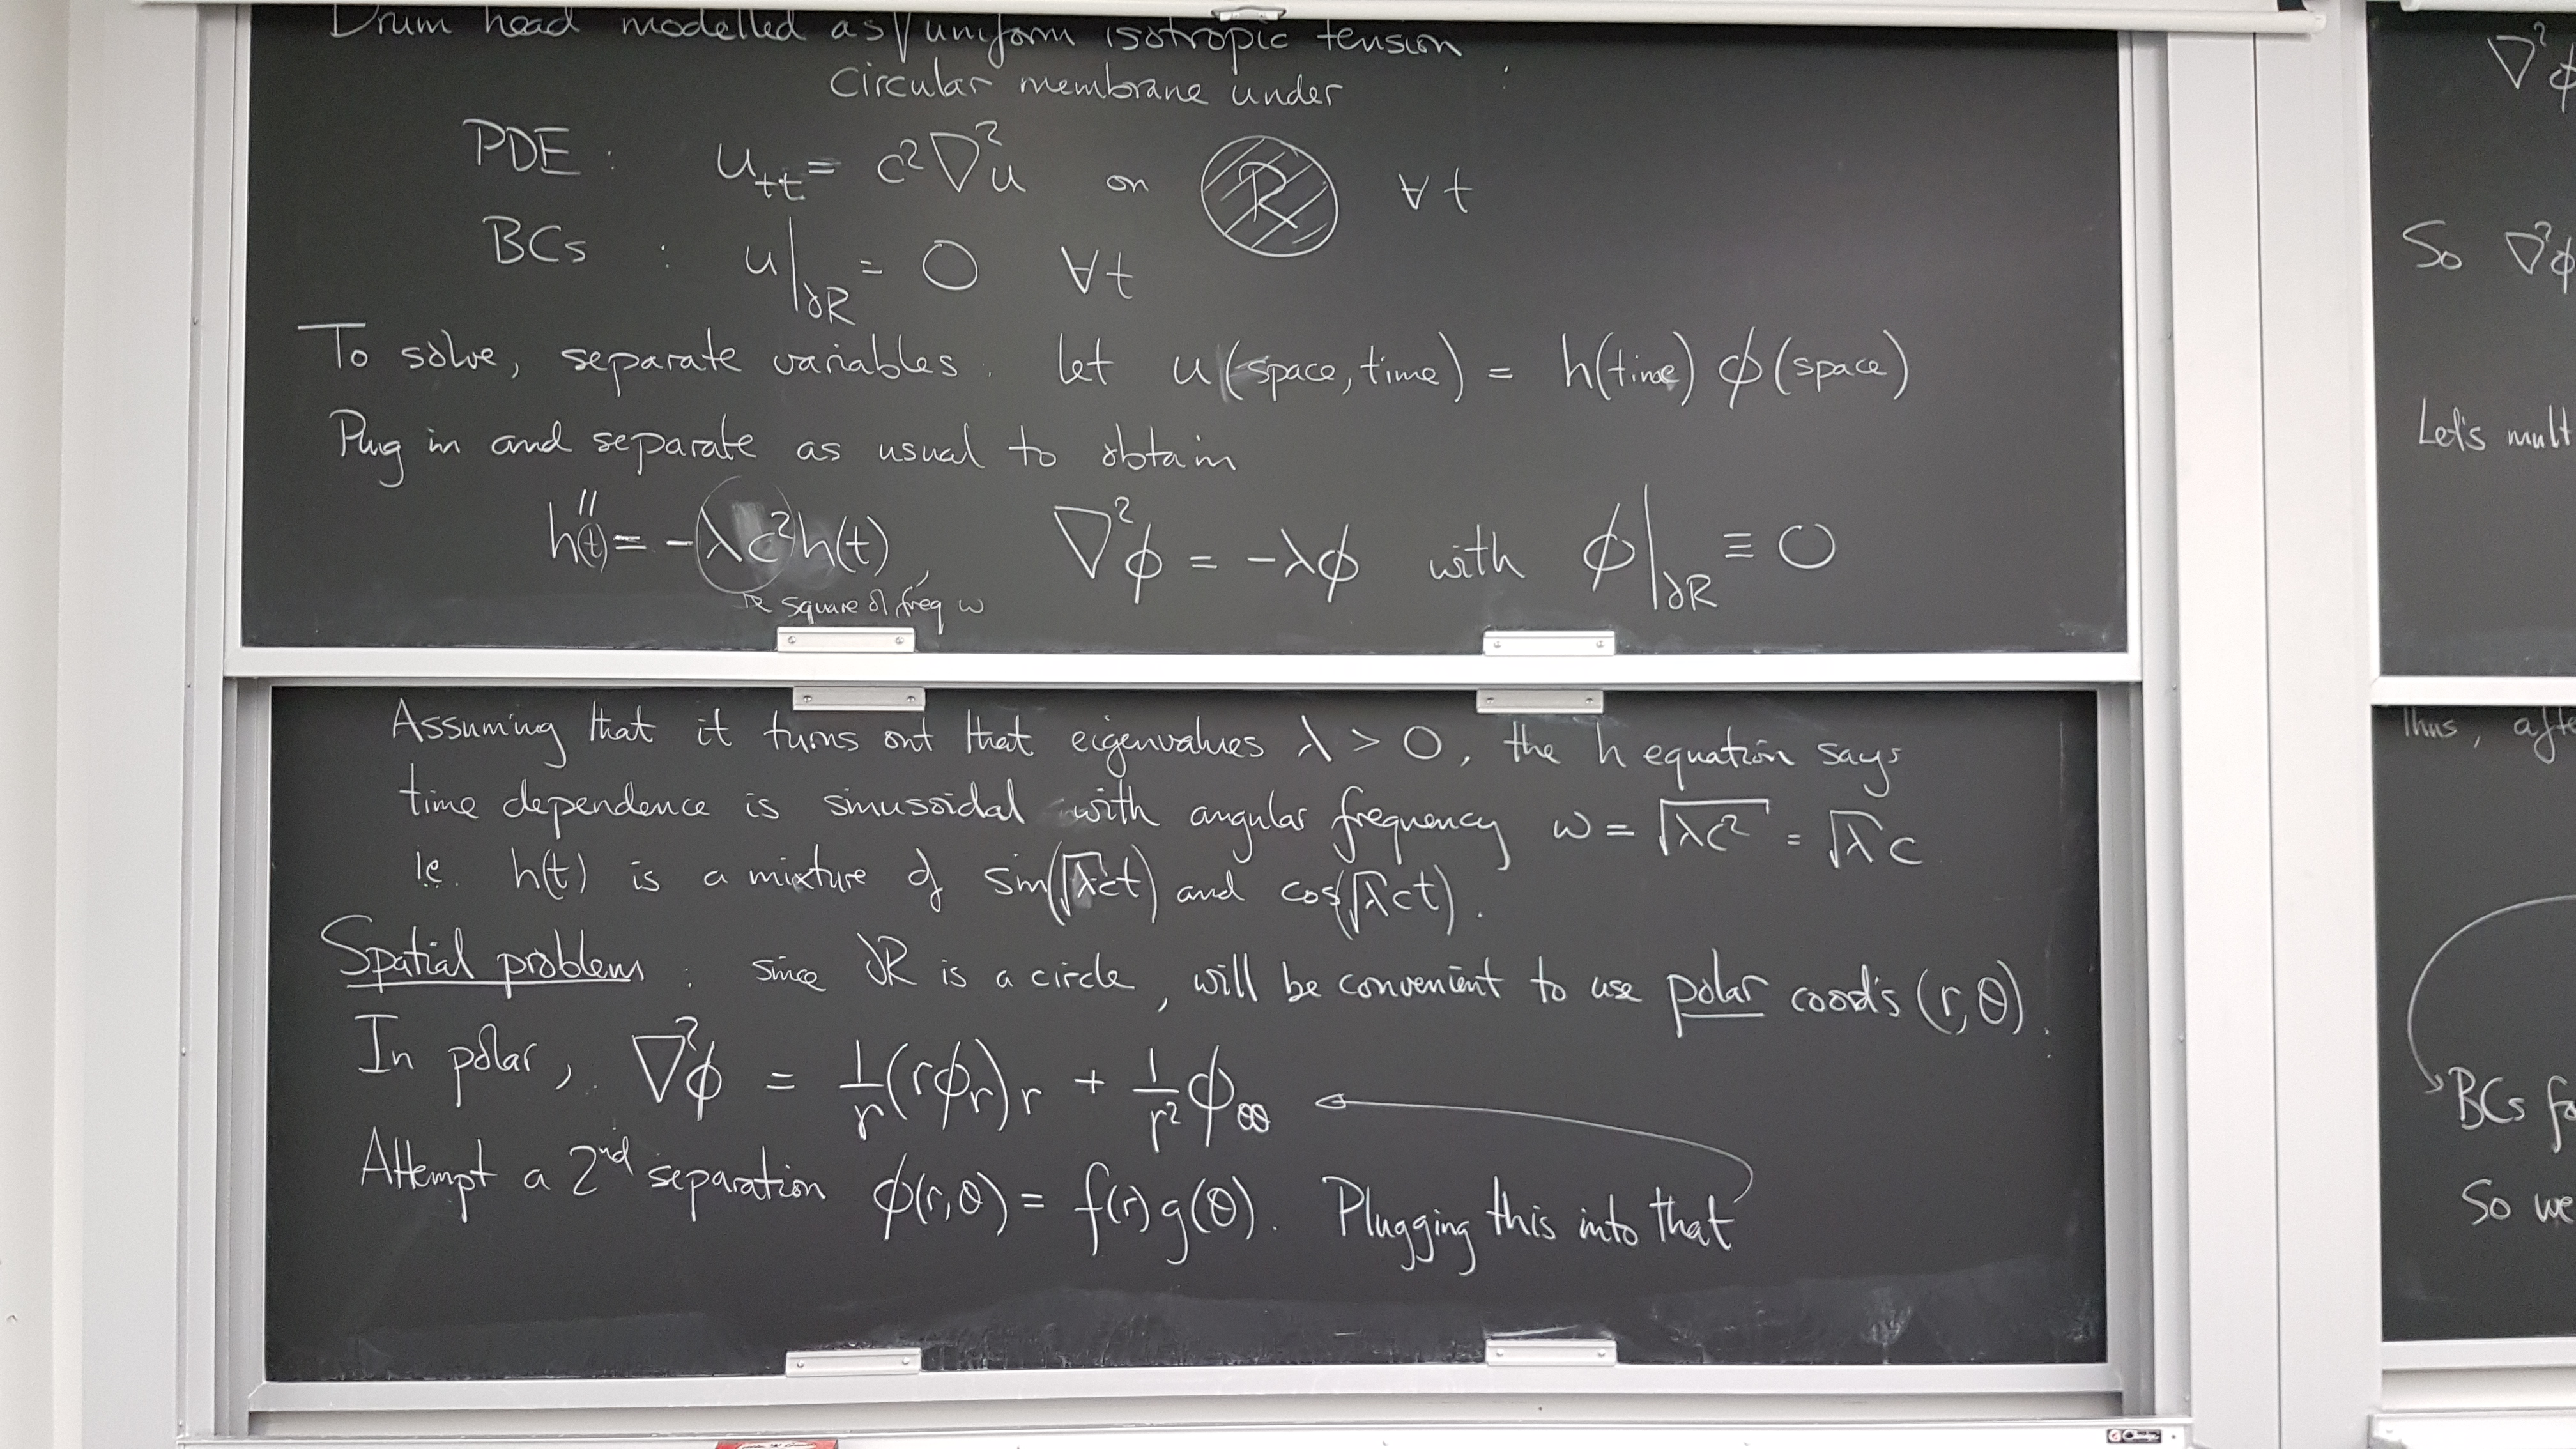
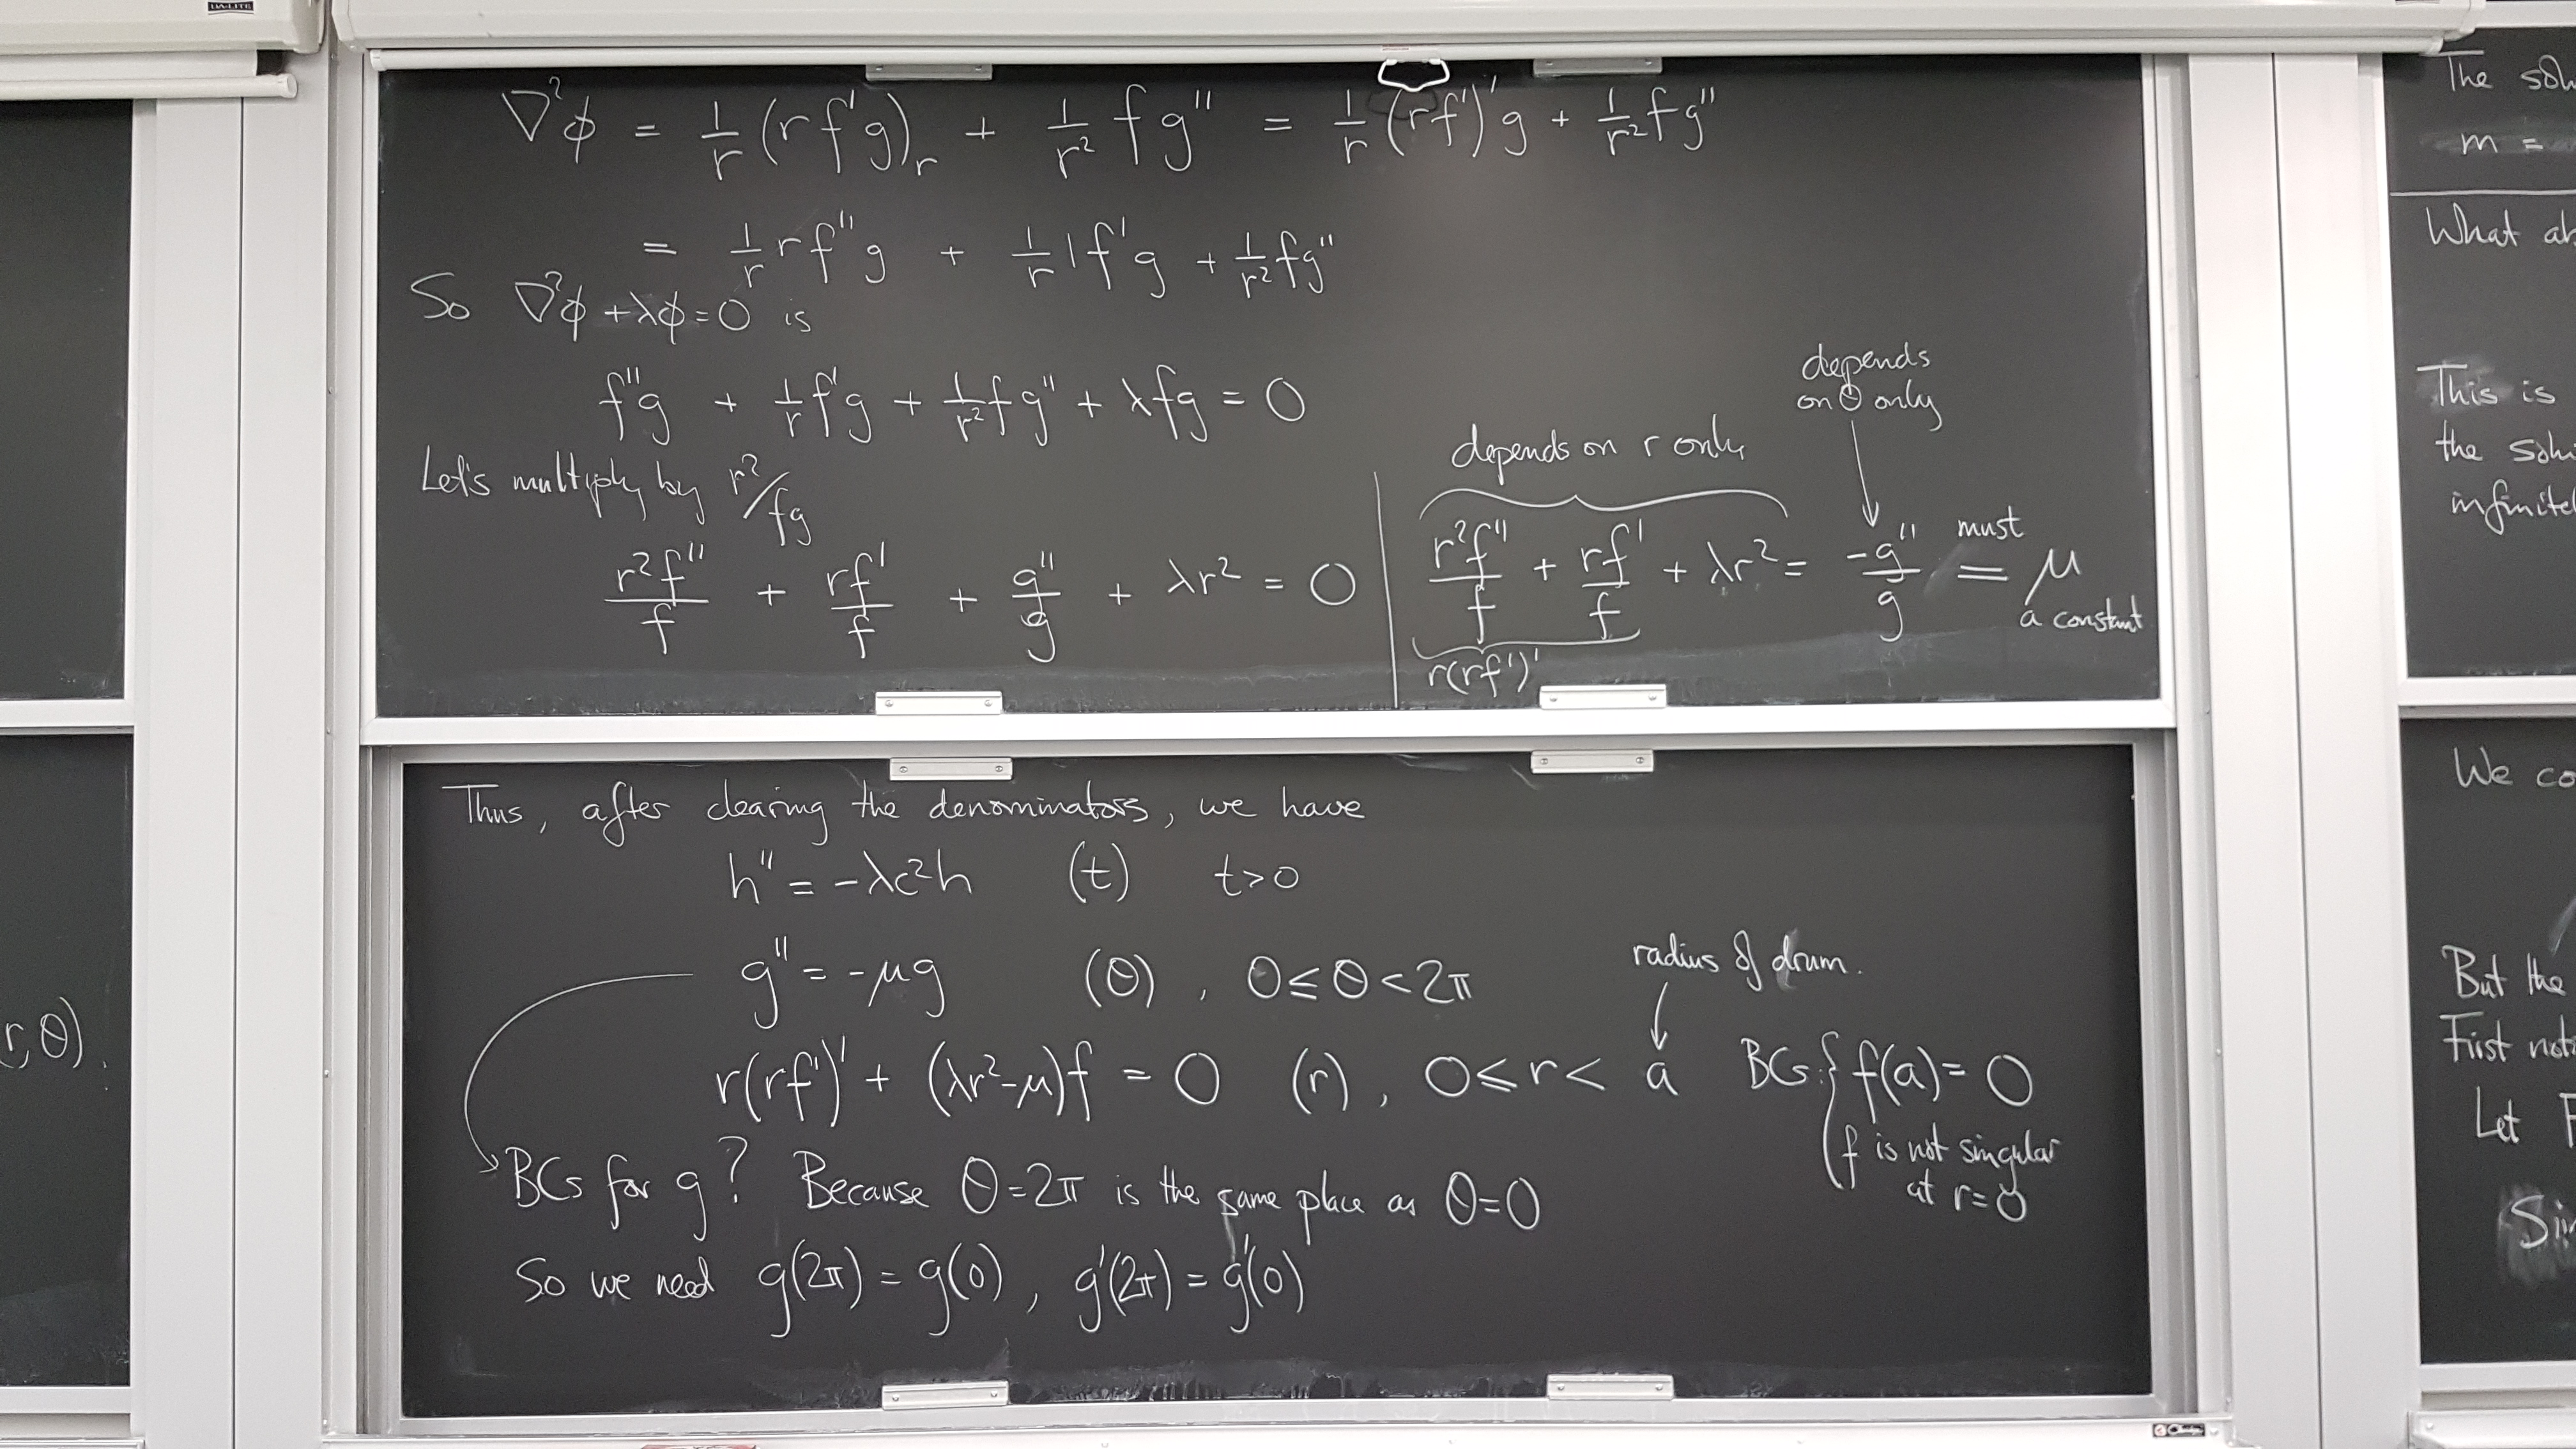
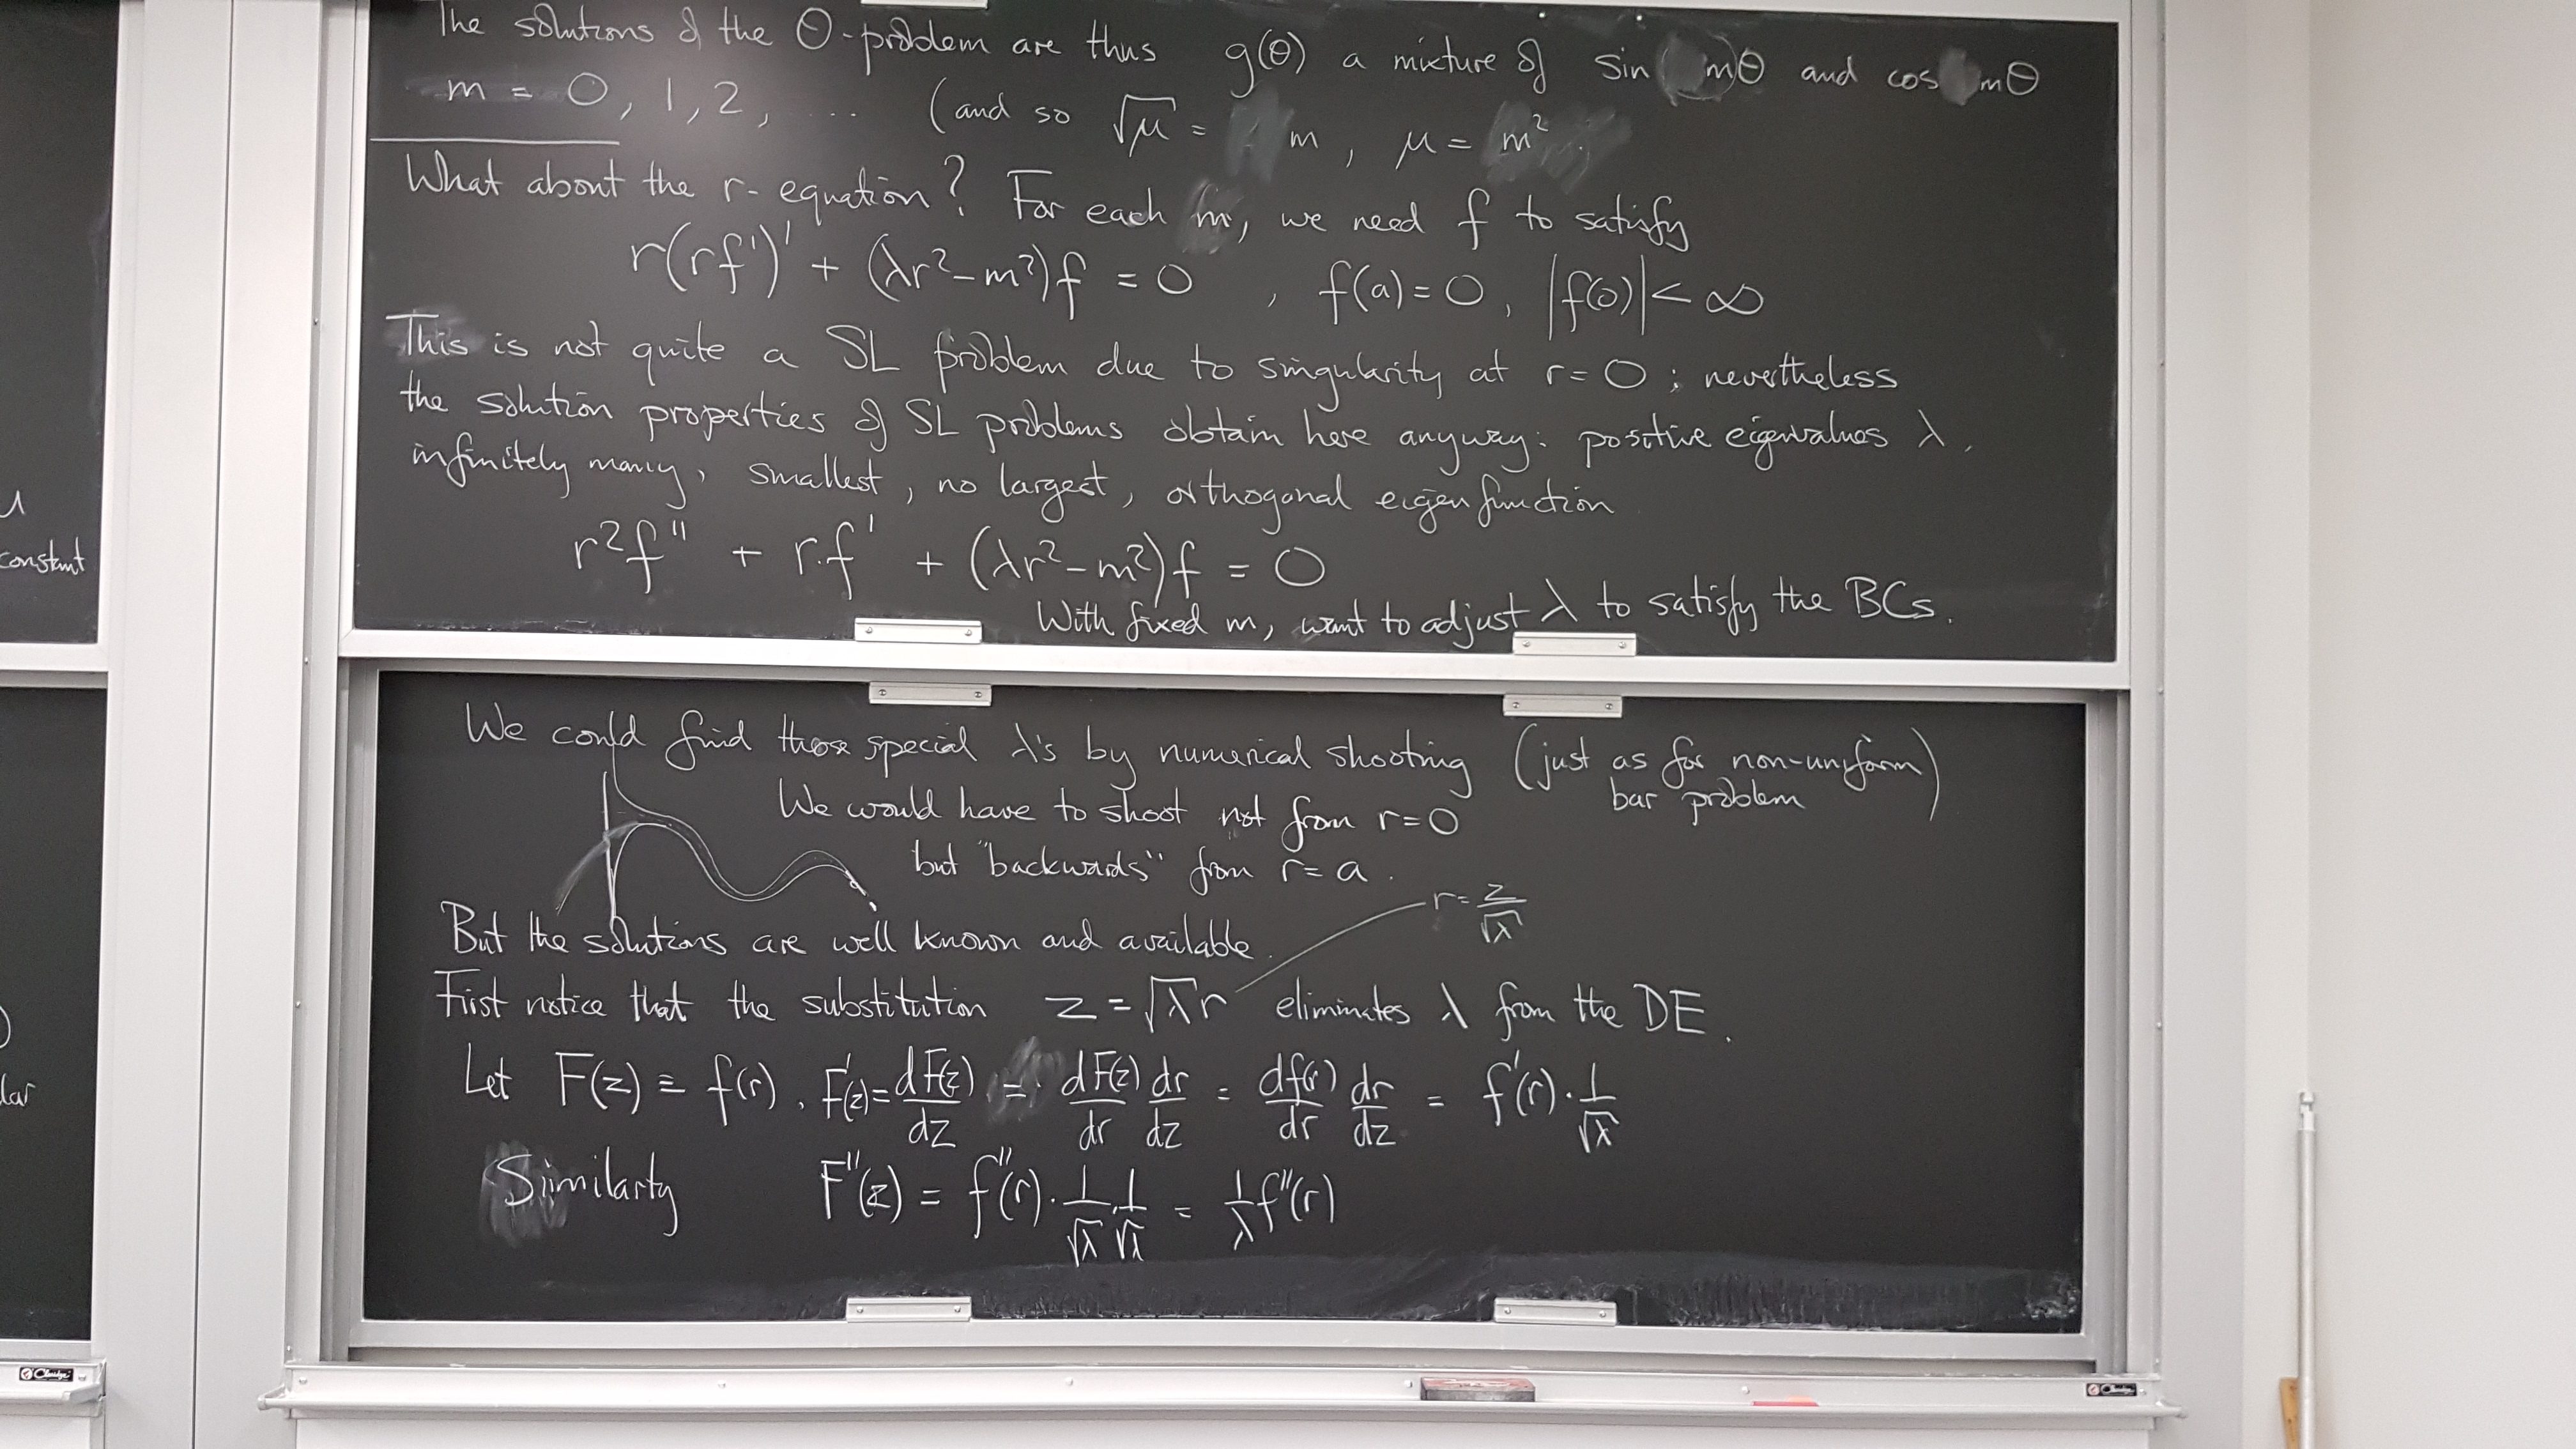
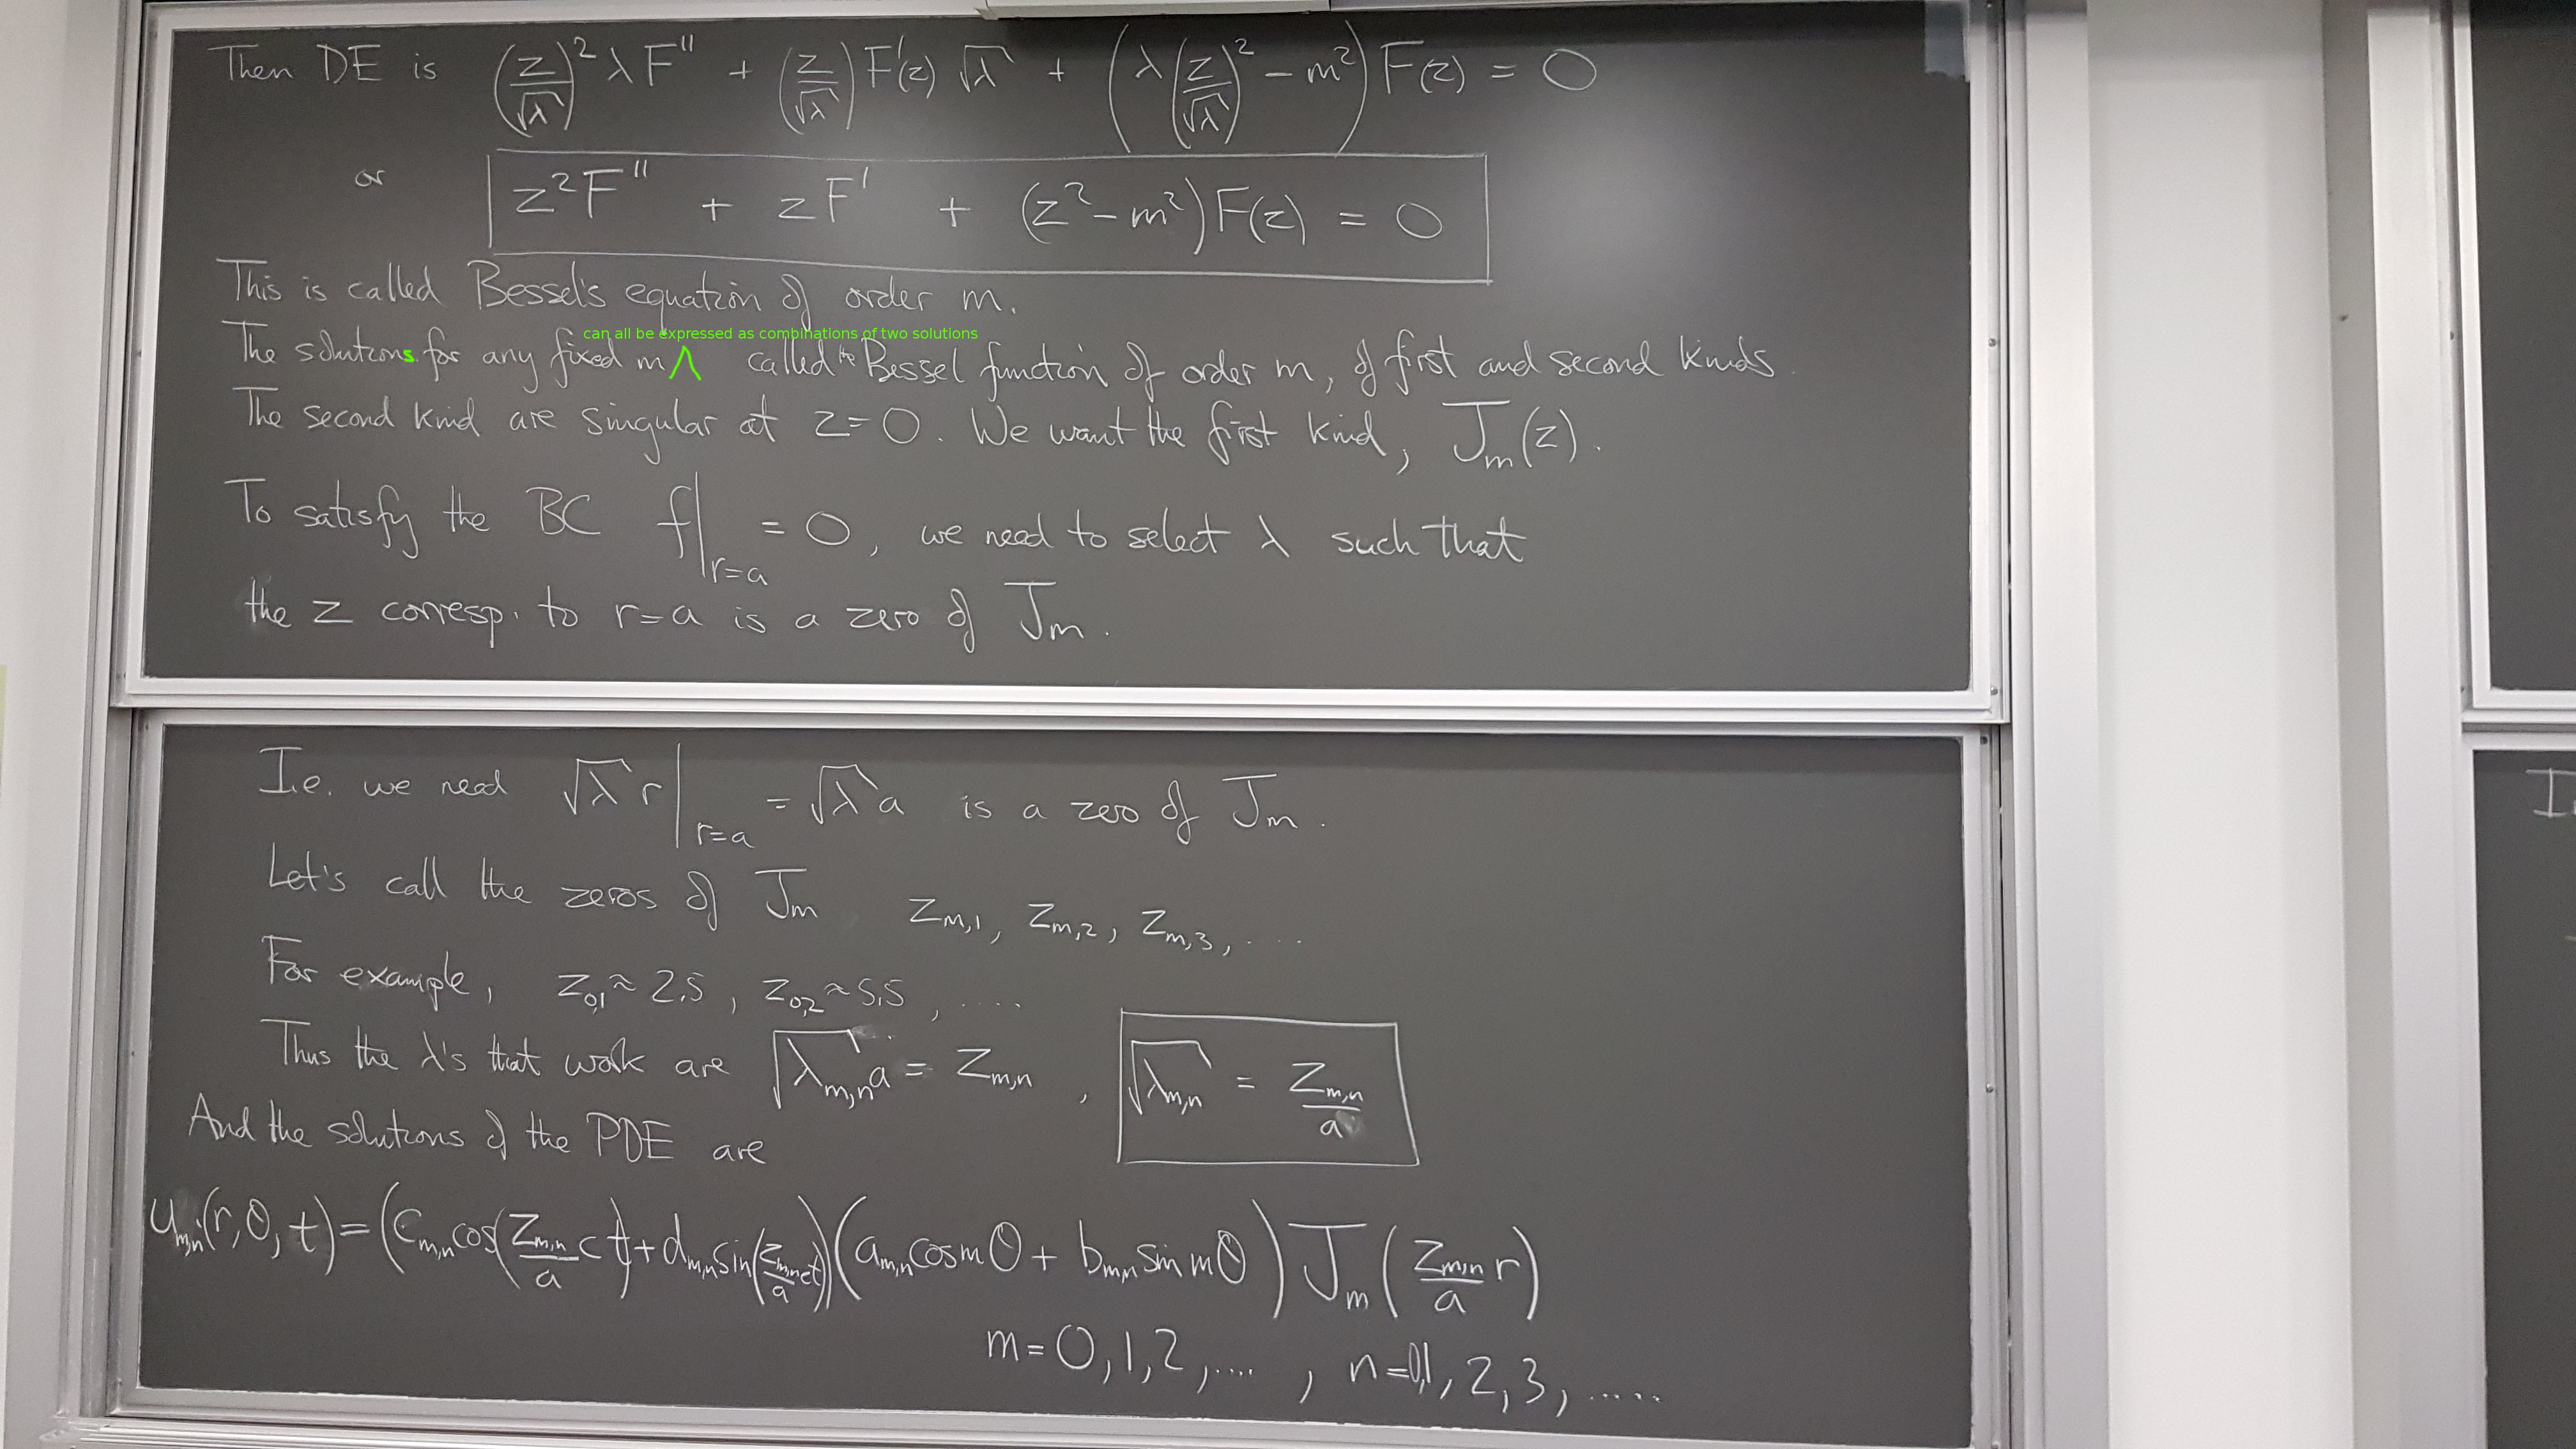
Solving the wave equation on a disk
Let's solve this problem by separation of variables, find the spectrum, and see if it matches the recording of the real drum.
Relationship between F and f:
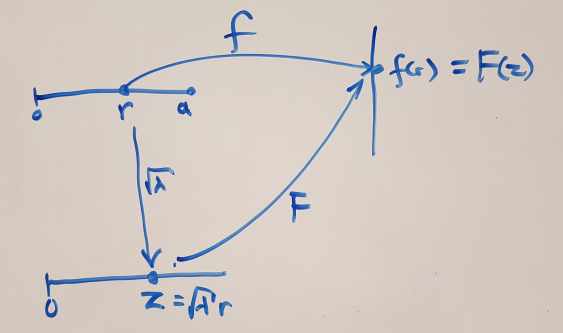
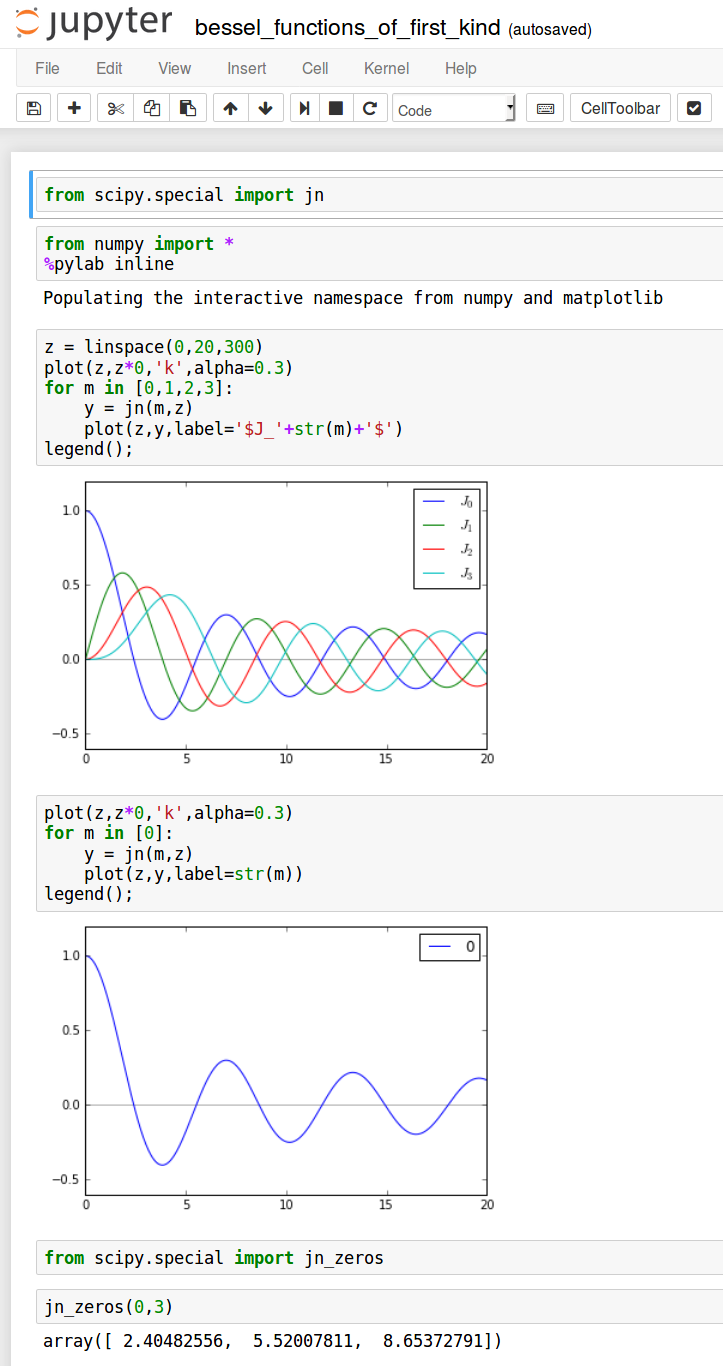
Code that made the picture above: circular_membrane_modes.py
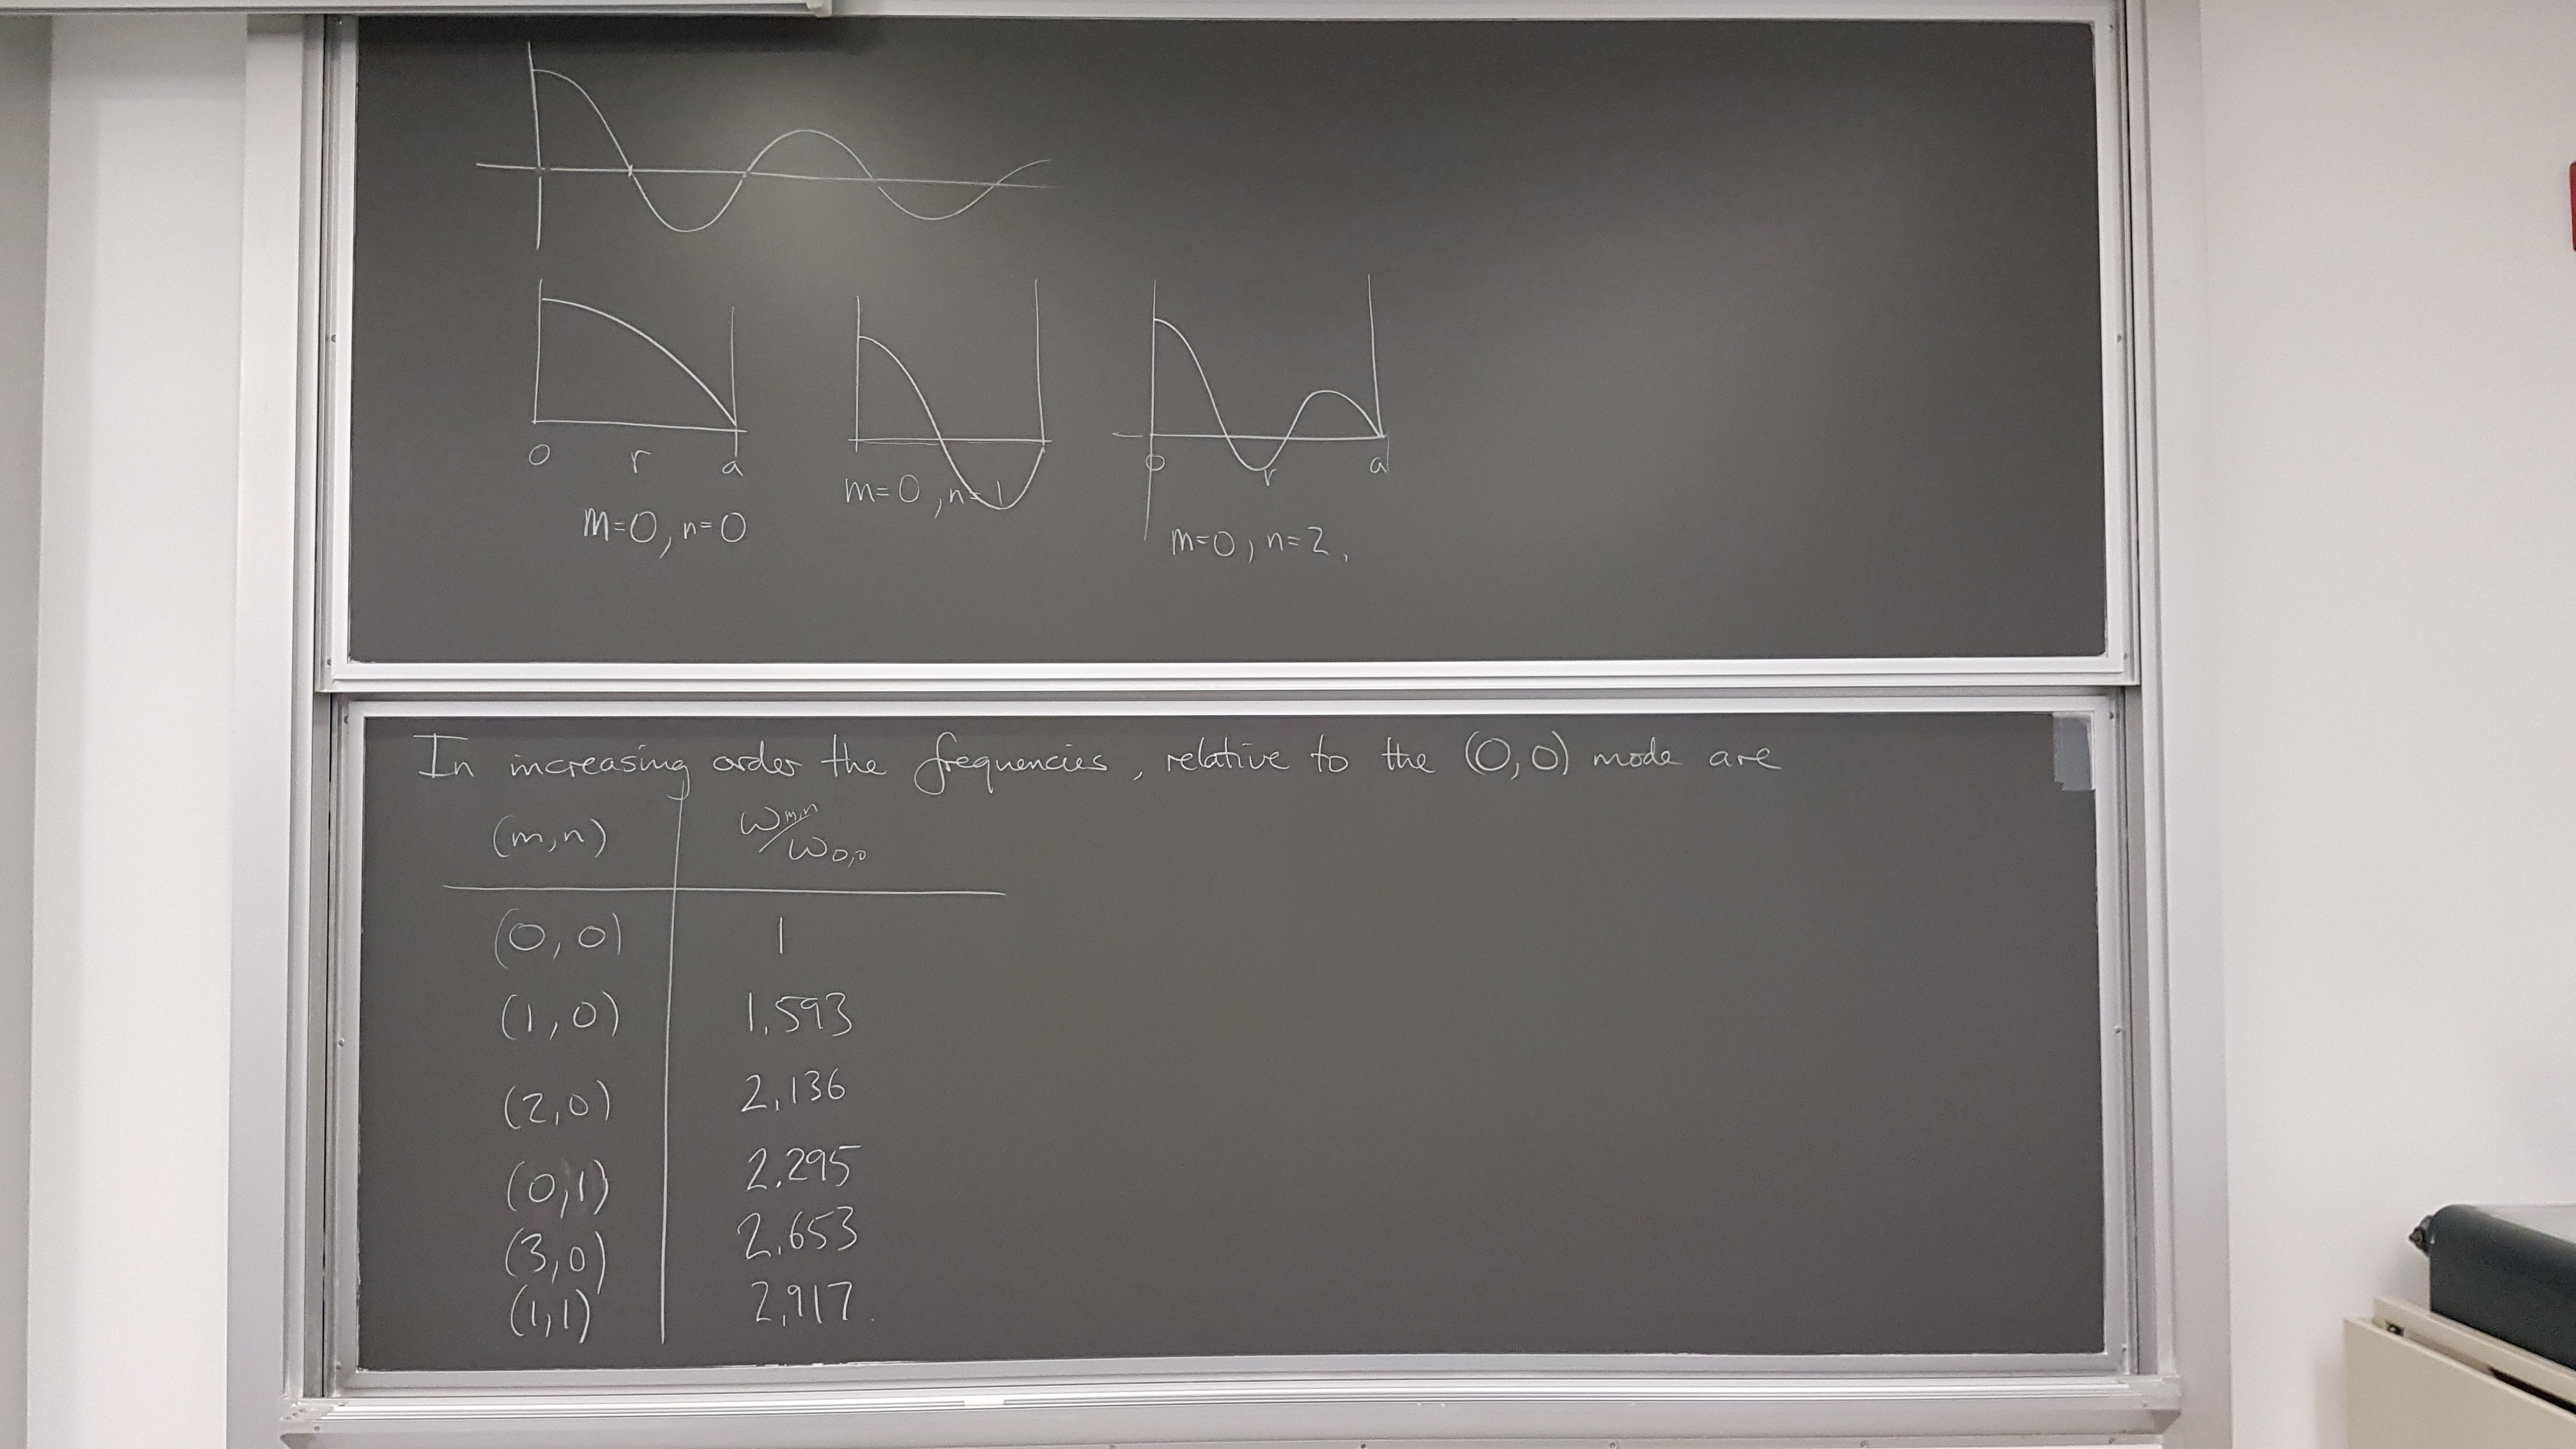
Synthesis of drum sound from solution of wave equation on disk
# enter frequency components here
freqs = 120.*array([1,1.593,2.136,2.295,2.653,2.917])
amps  = array([1.,1,1,1,1,1])
synthesized_drum.wav (first effort, just guessing frequency of fundamental)