Day 26
Tuesday, May 9, 2017
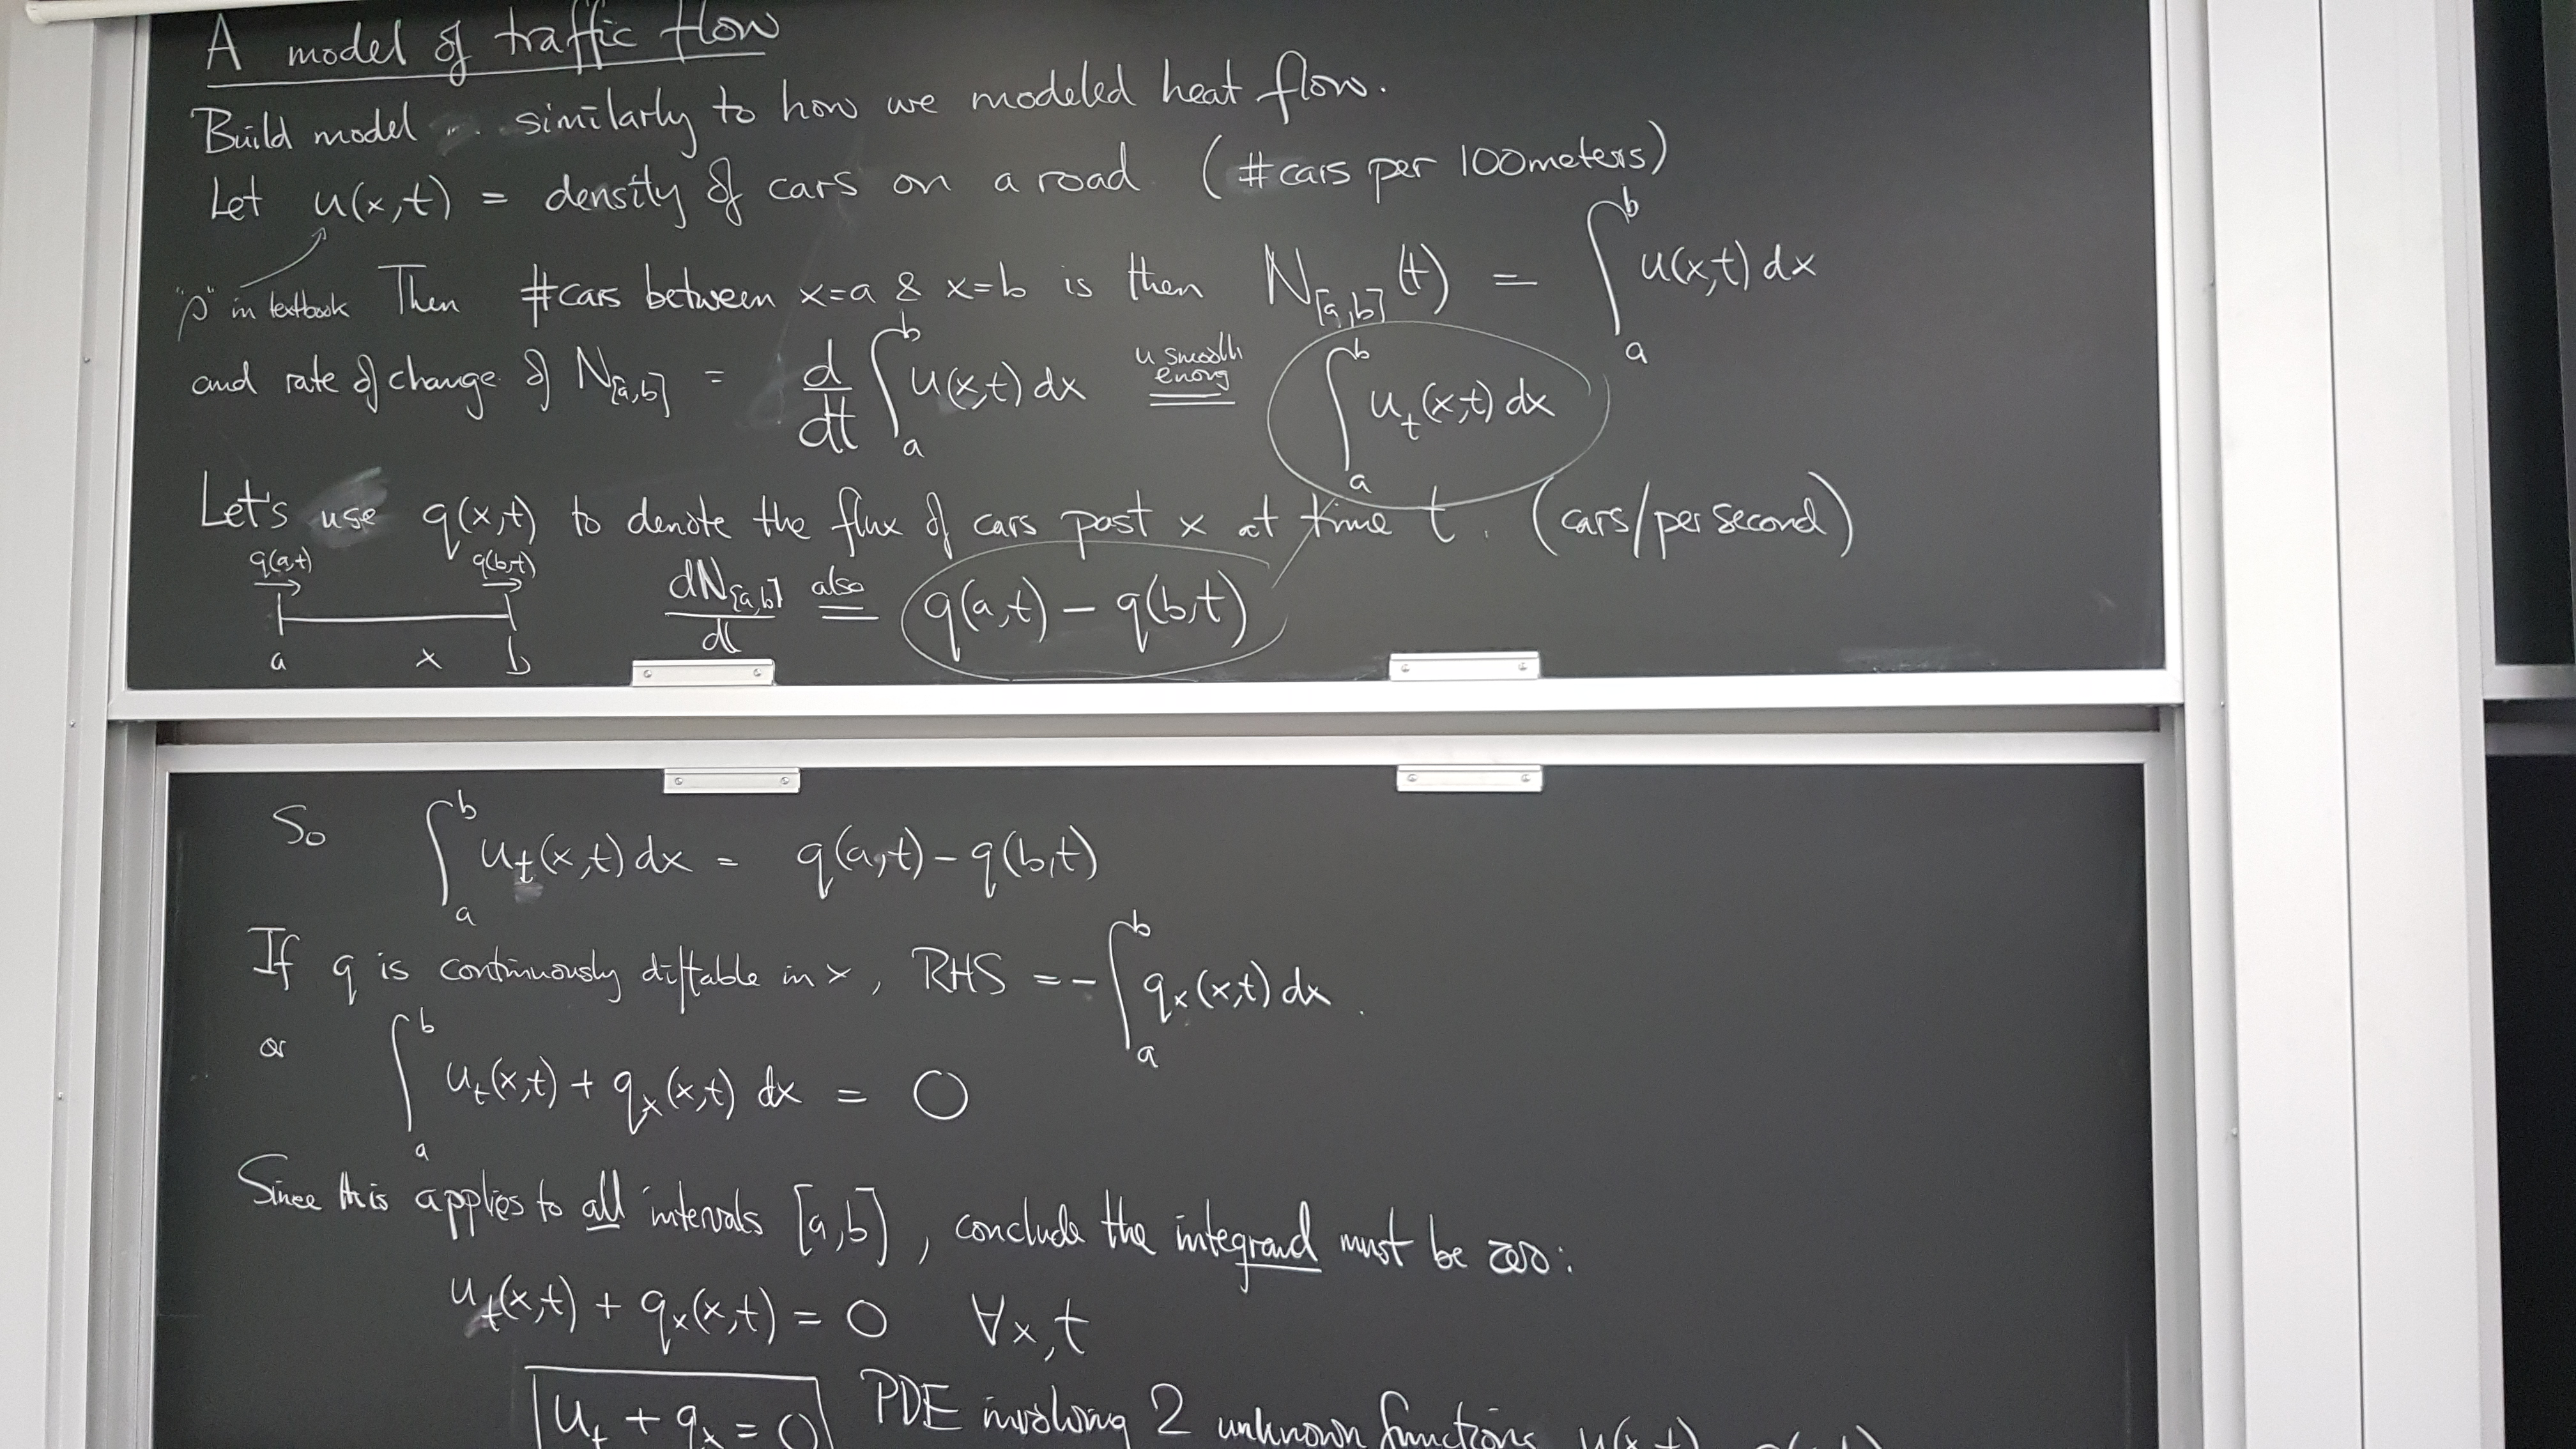
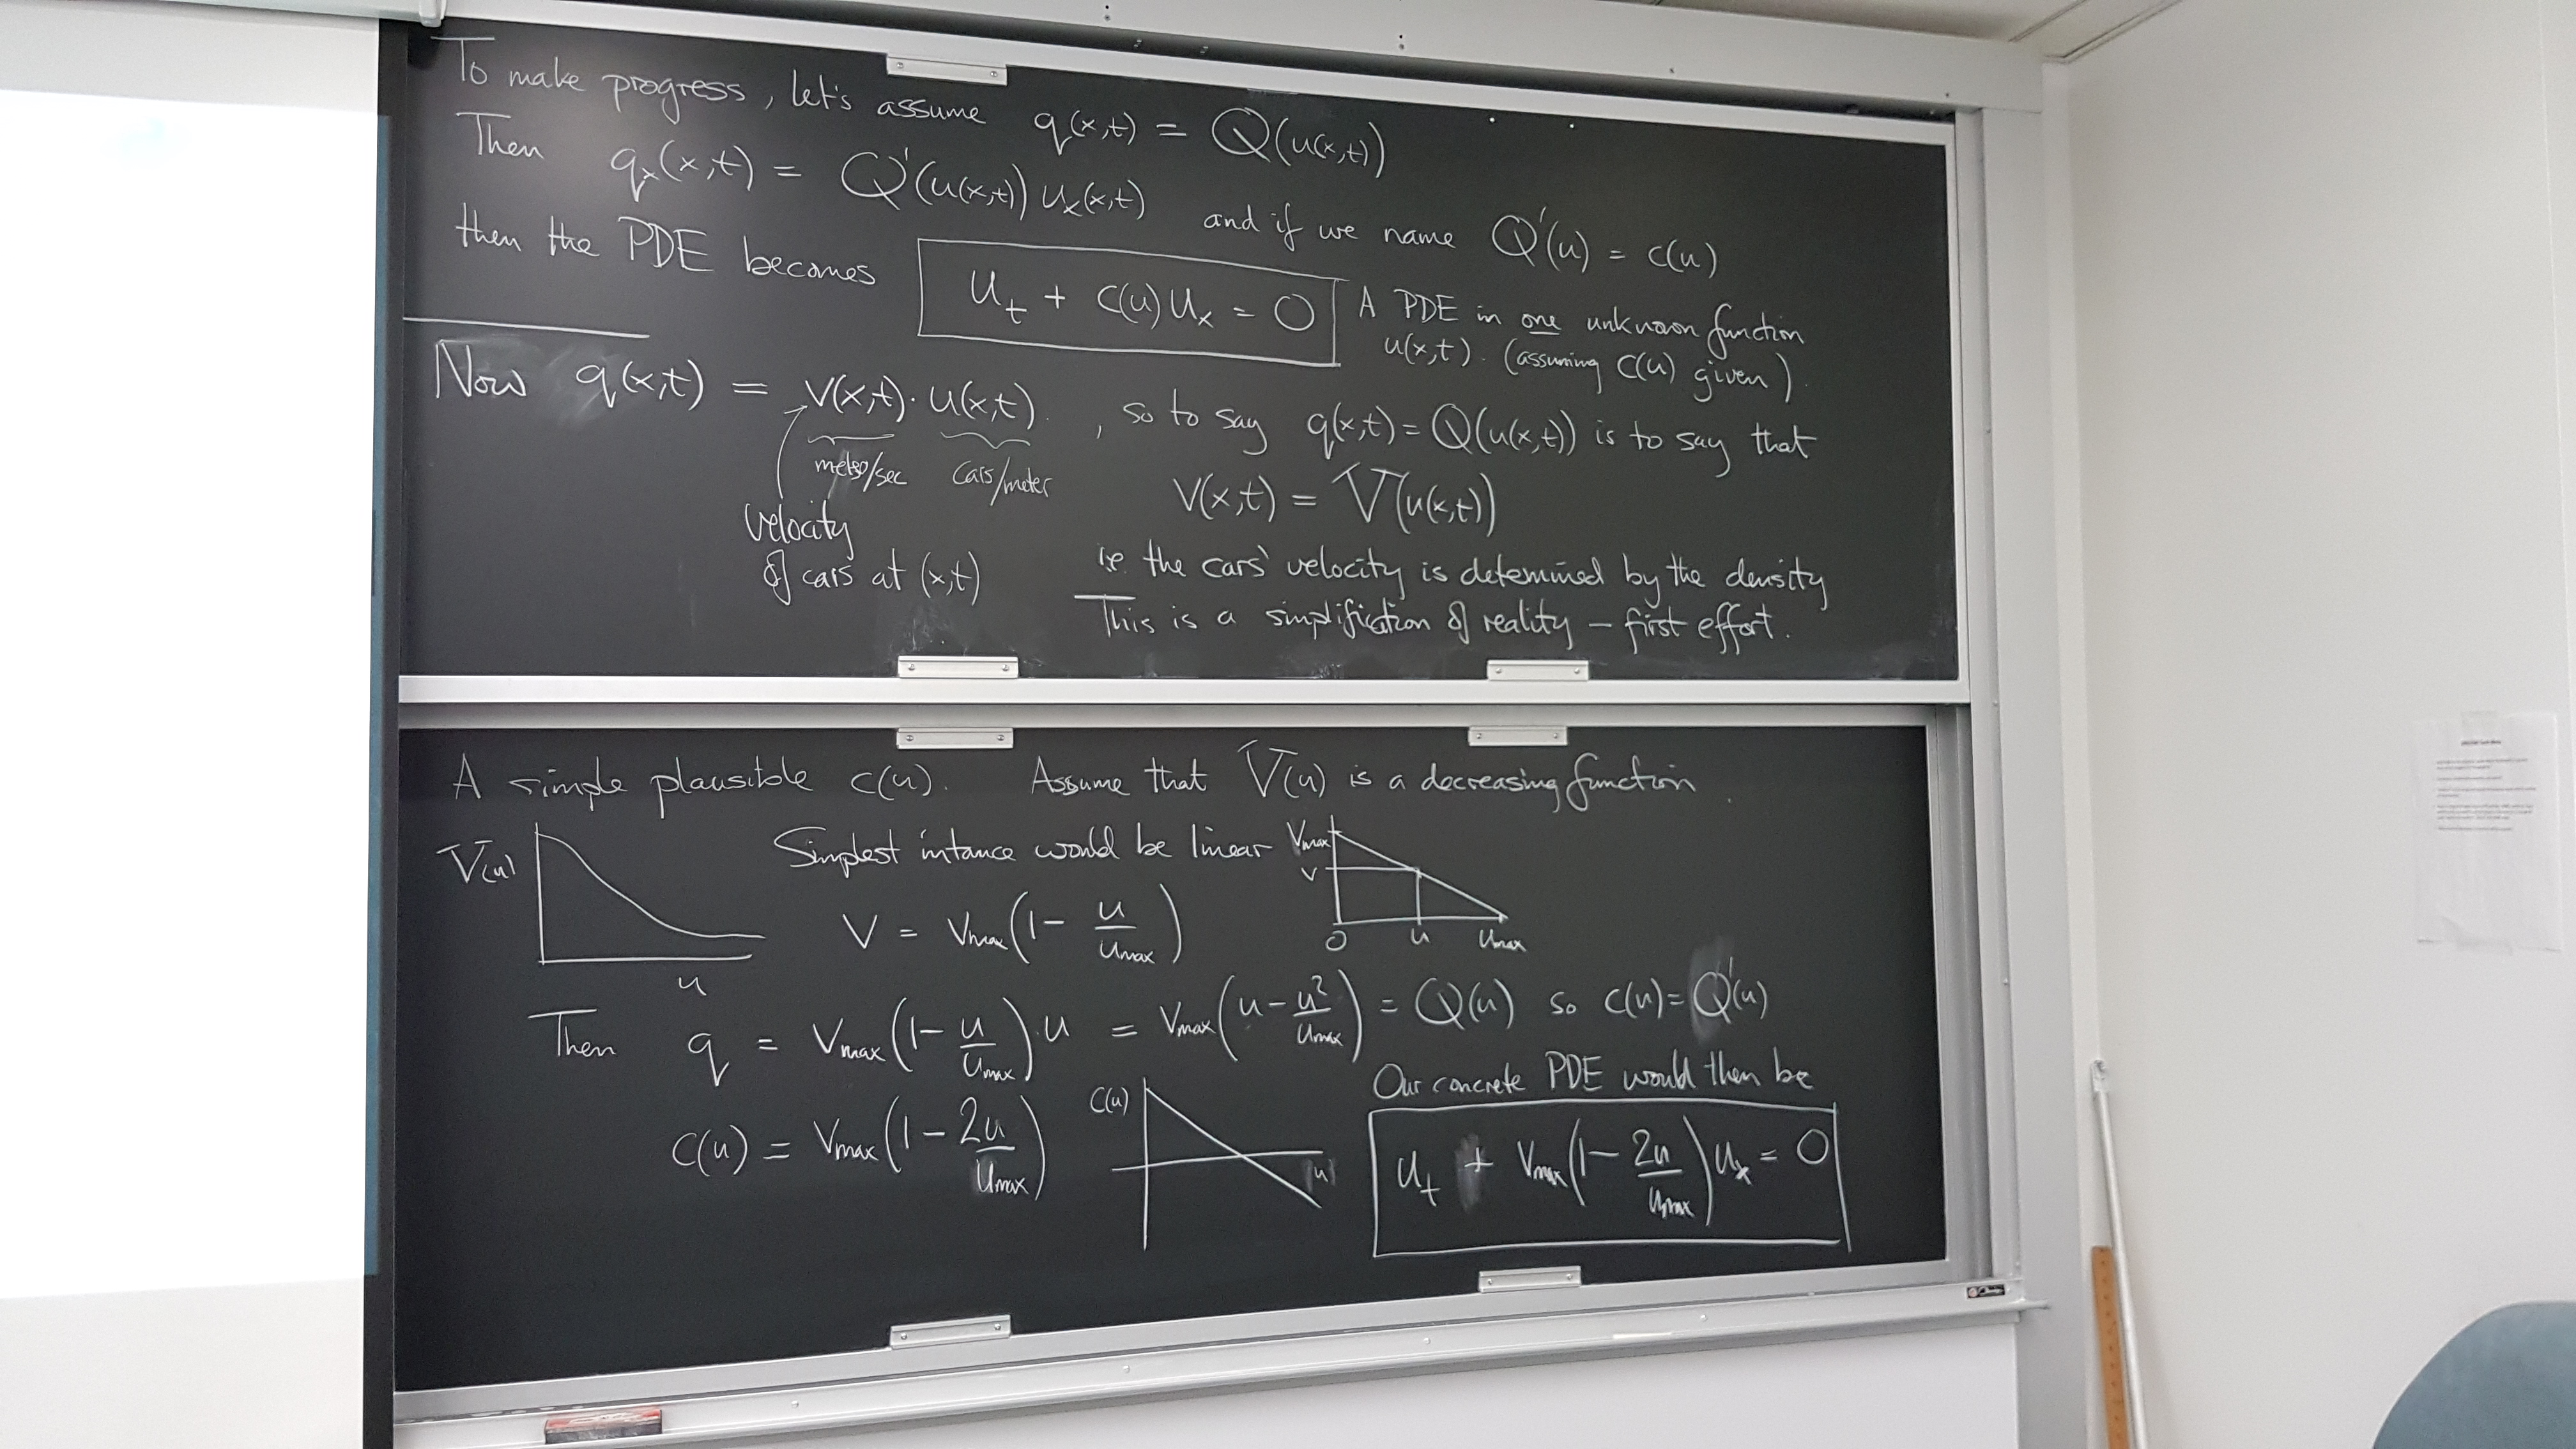
A model of traffic flow
Example
Case: initial density decreasing downstream:
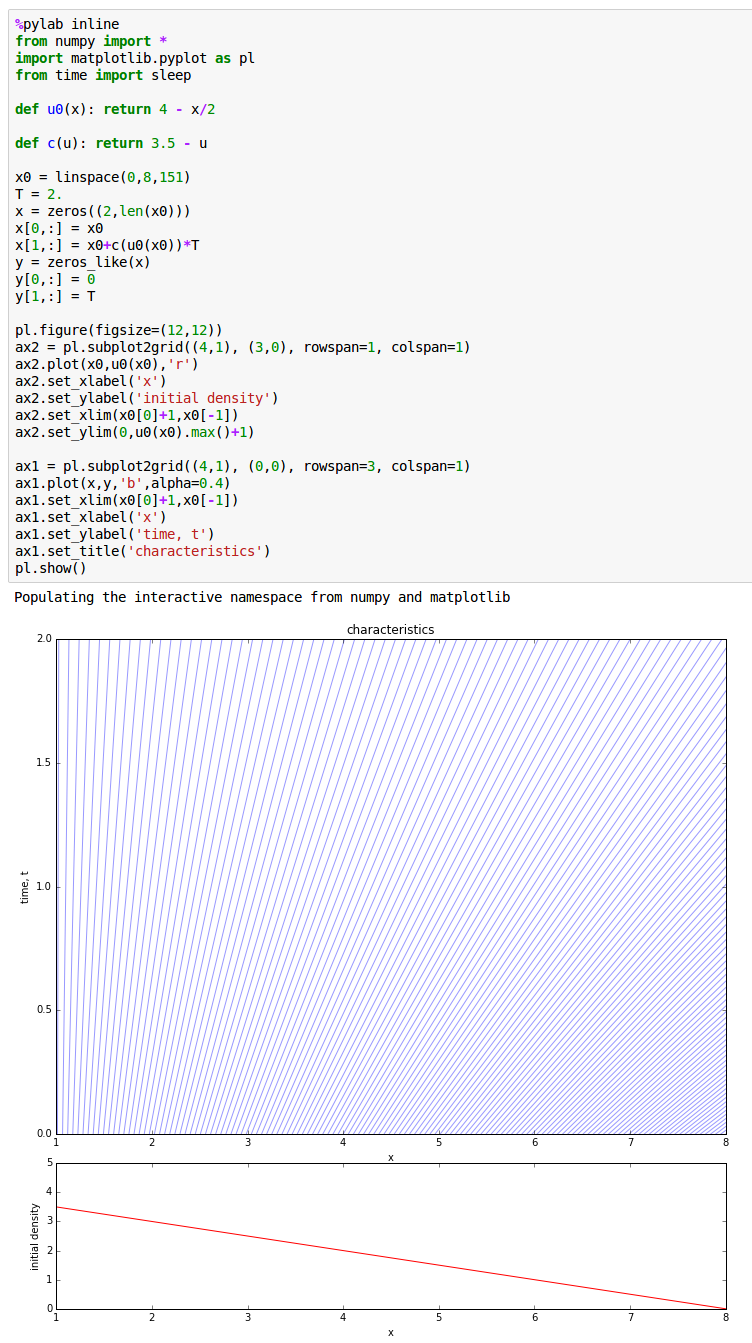
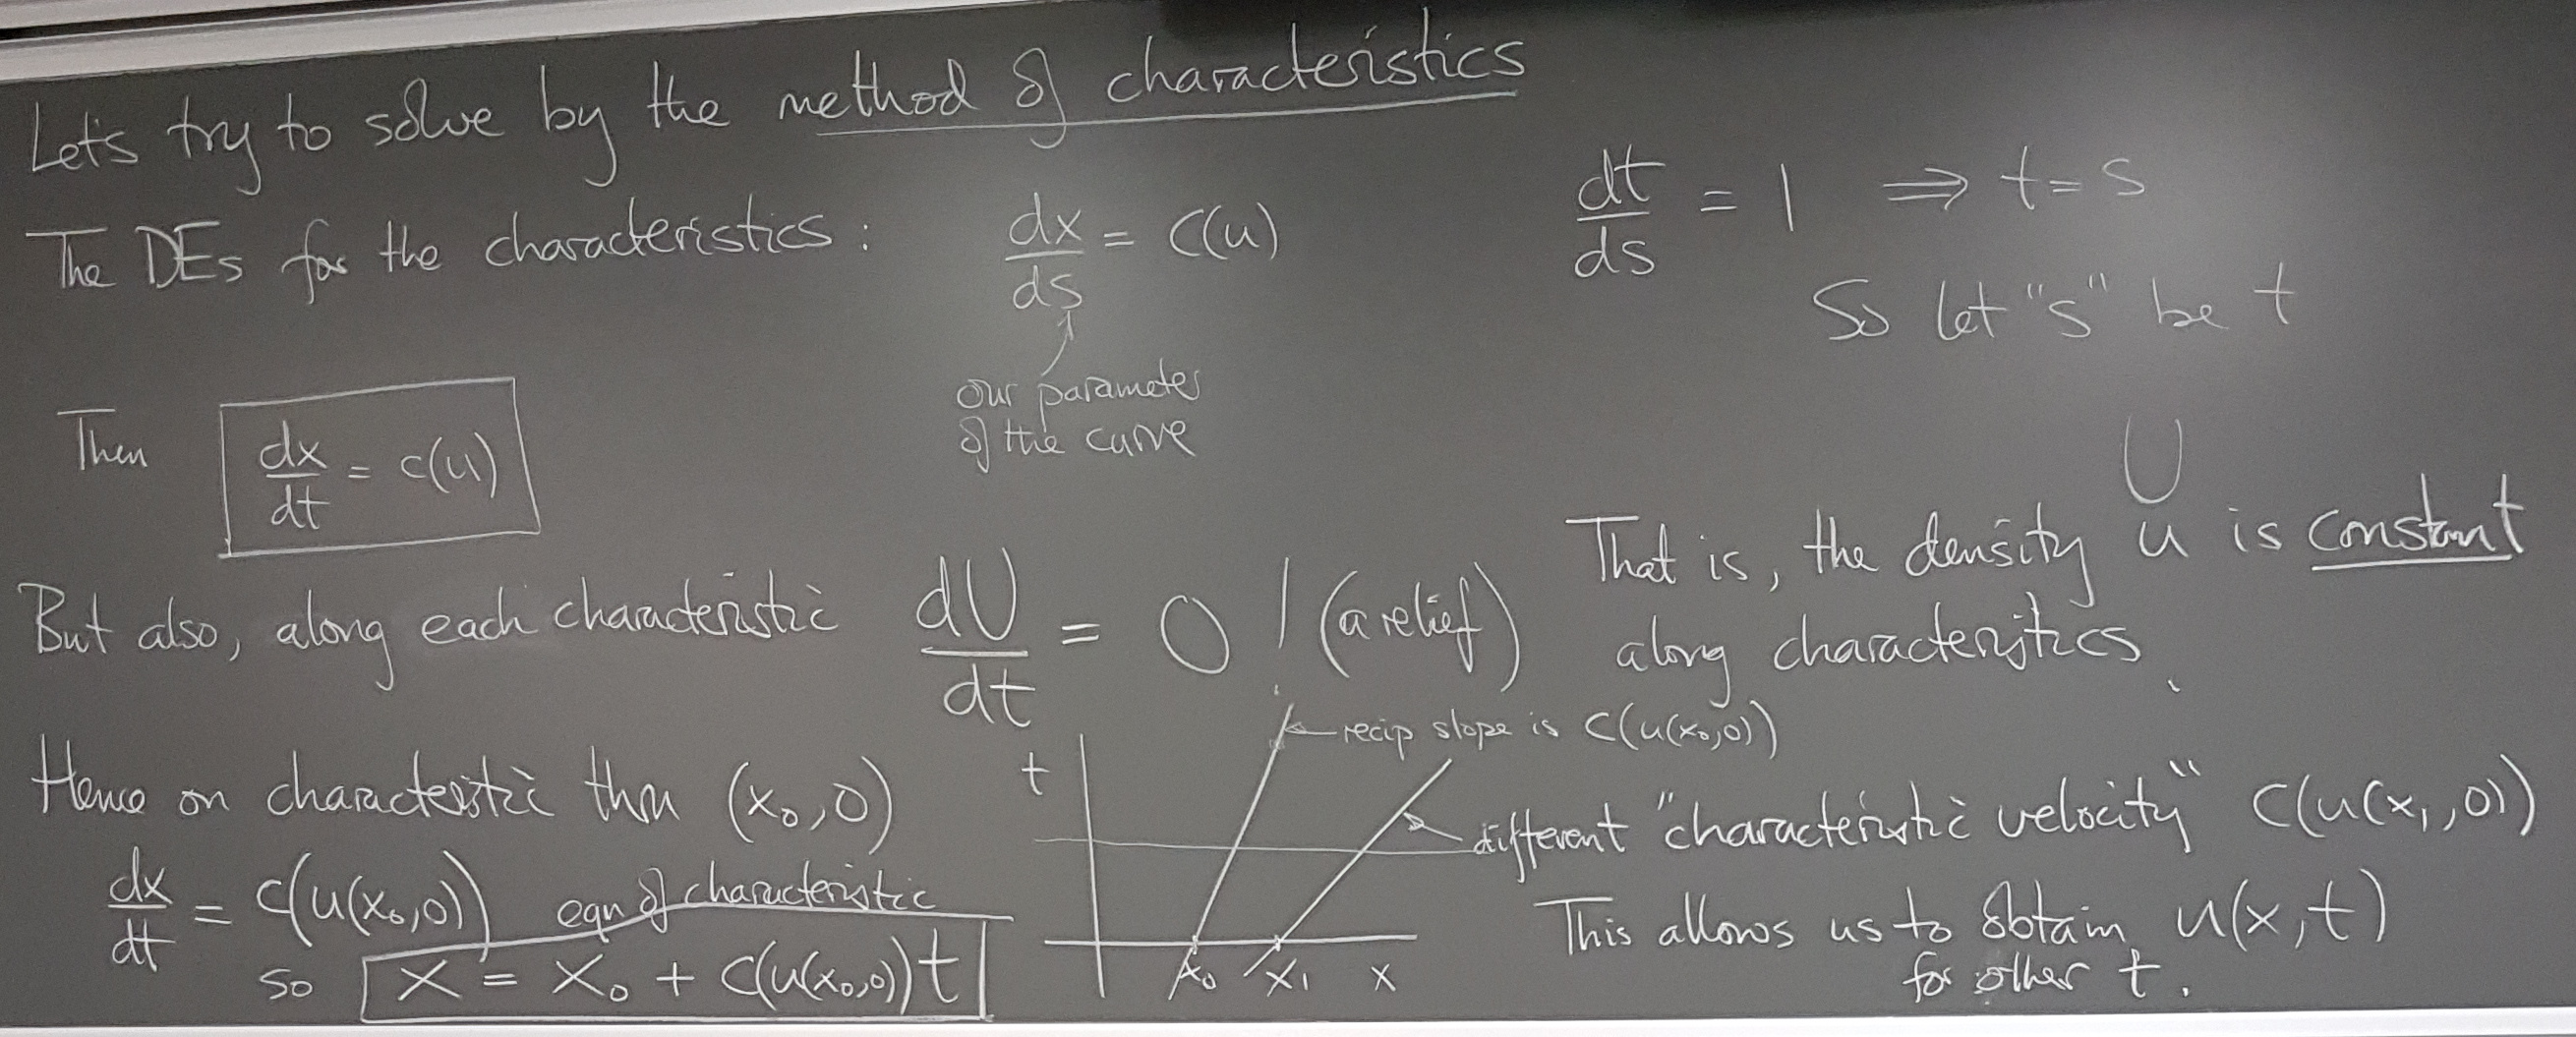
We can easily calculate the density at any place or time because the density is constant along the characteristics.
Case: some initial density increase downstream:
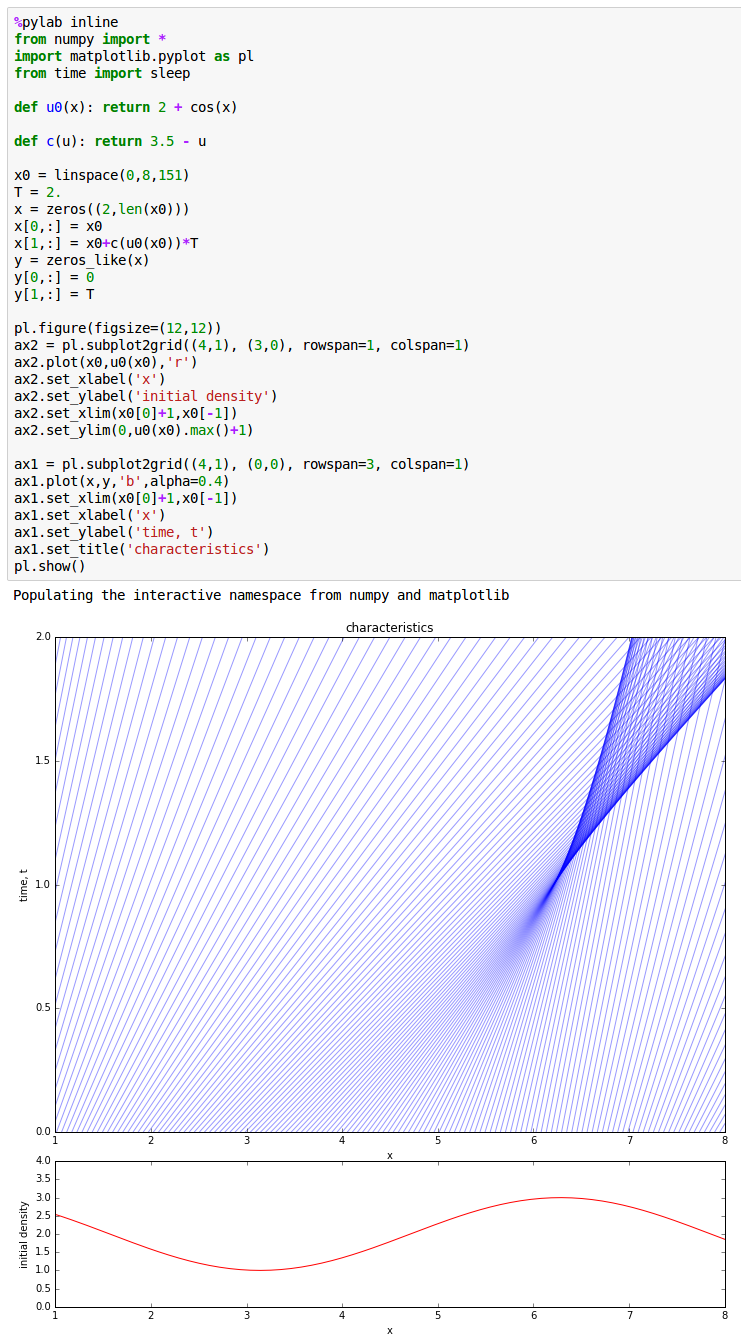
After some time (t=1 in this case), an inconsistency arises: characteristics collide, giving inconsistent information about u at the point of collision.
Here is another view:
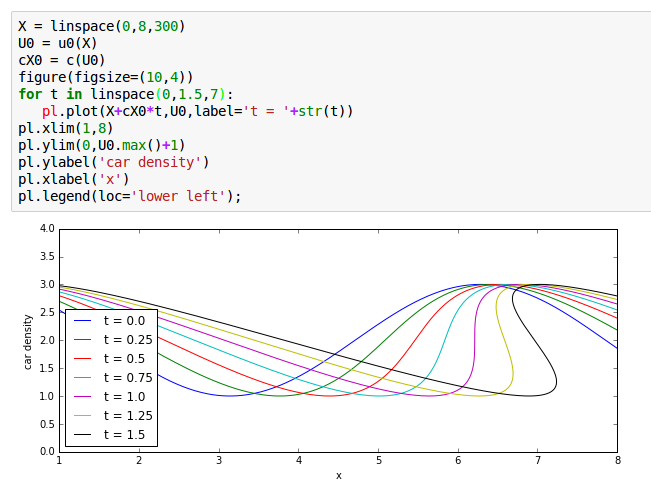
Beyond t=1 we have nonsensical multiple values of u predicted for some values of x.
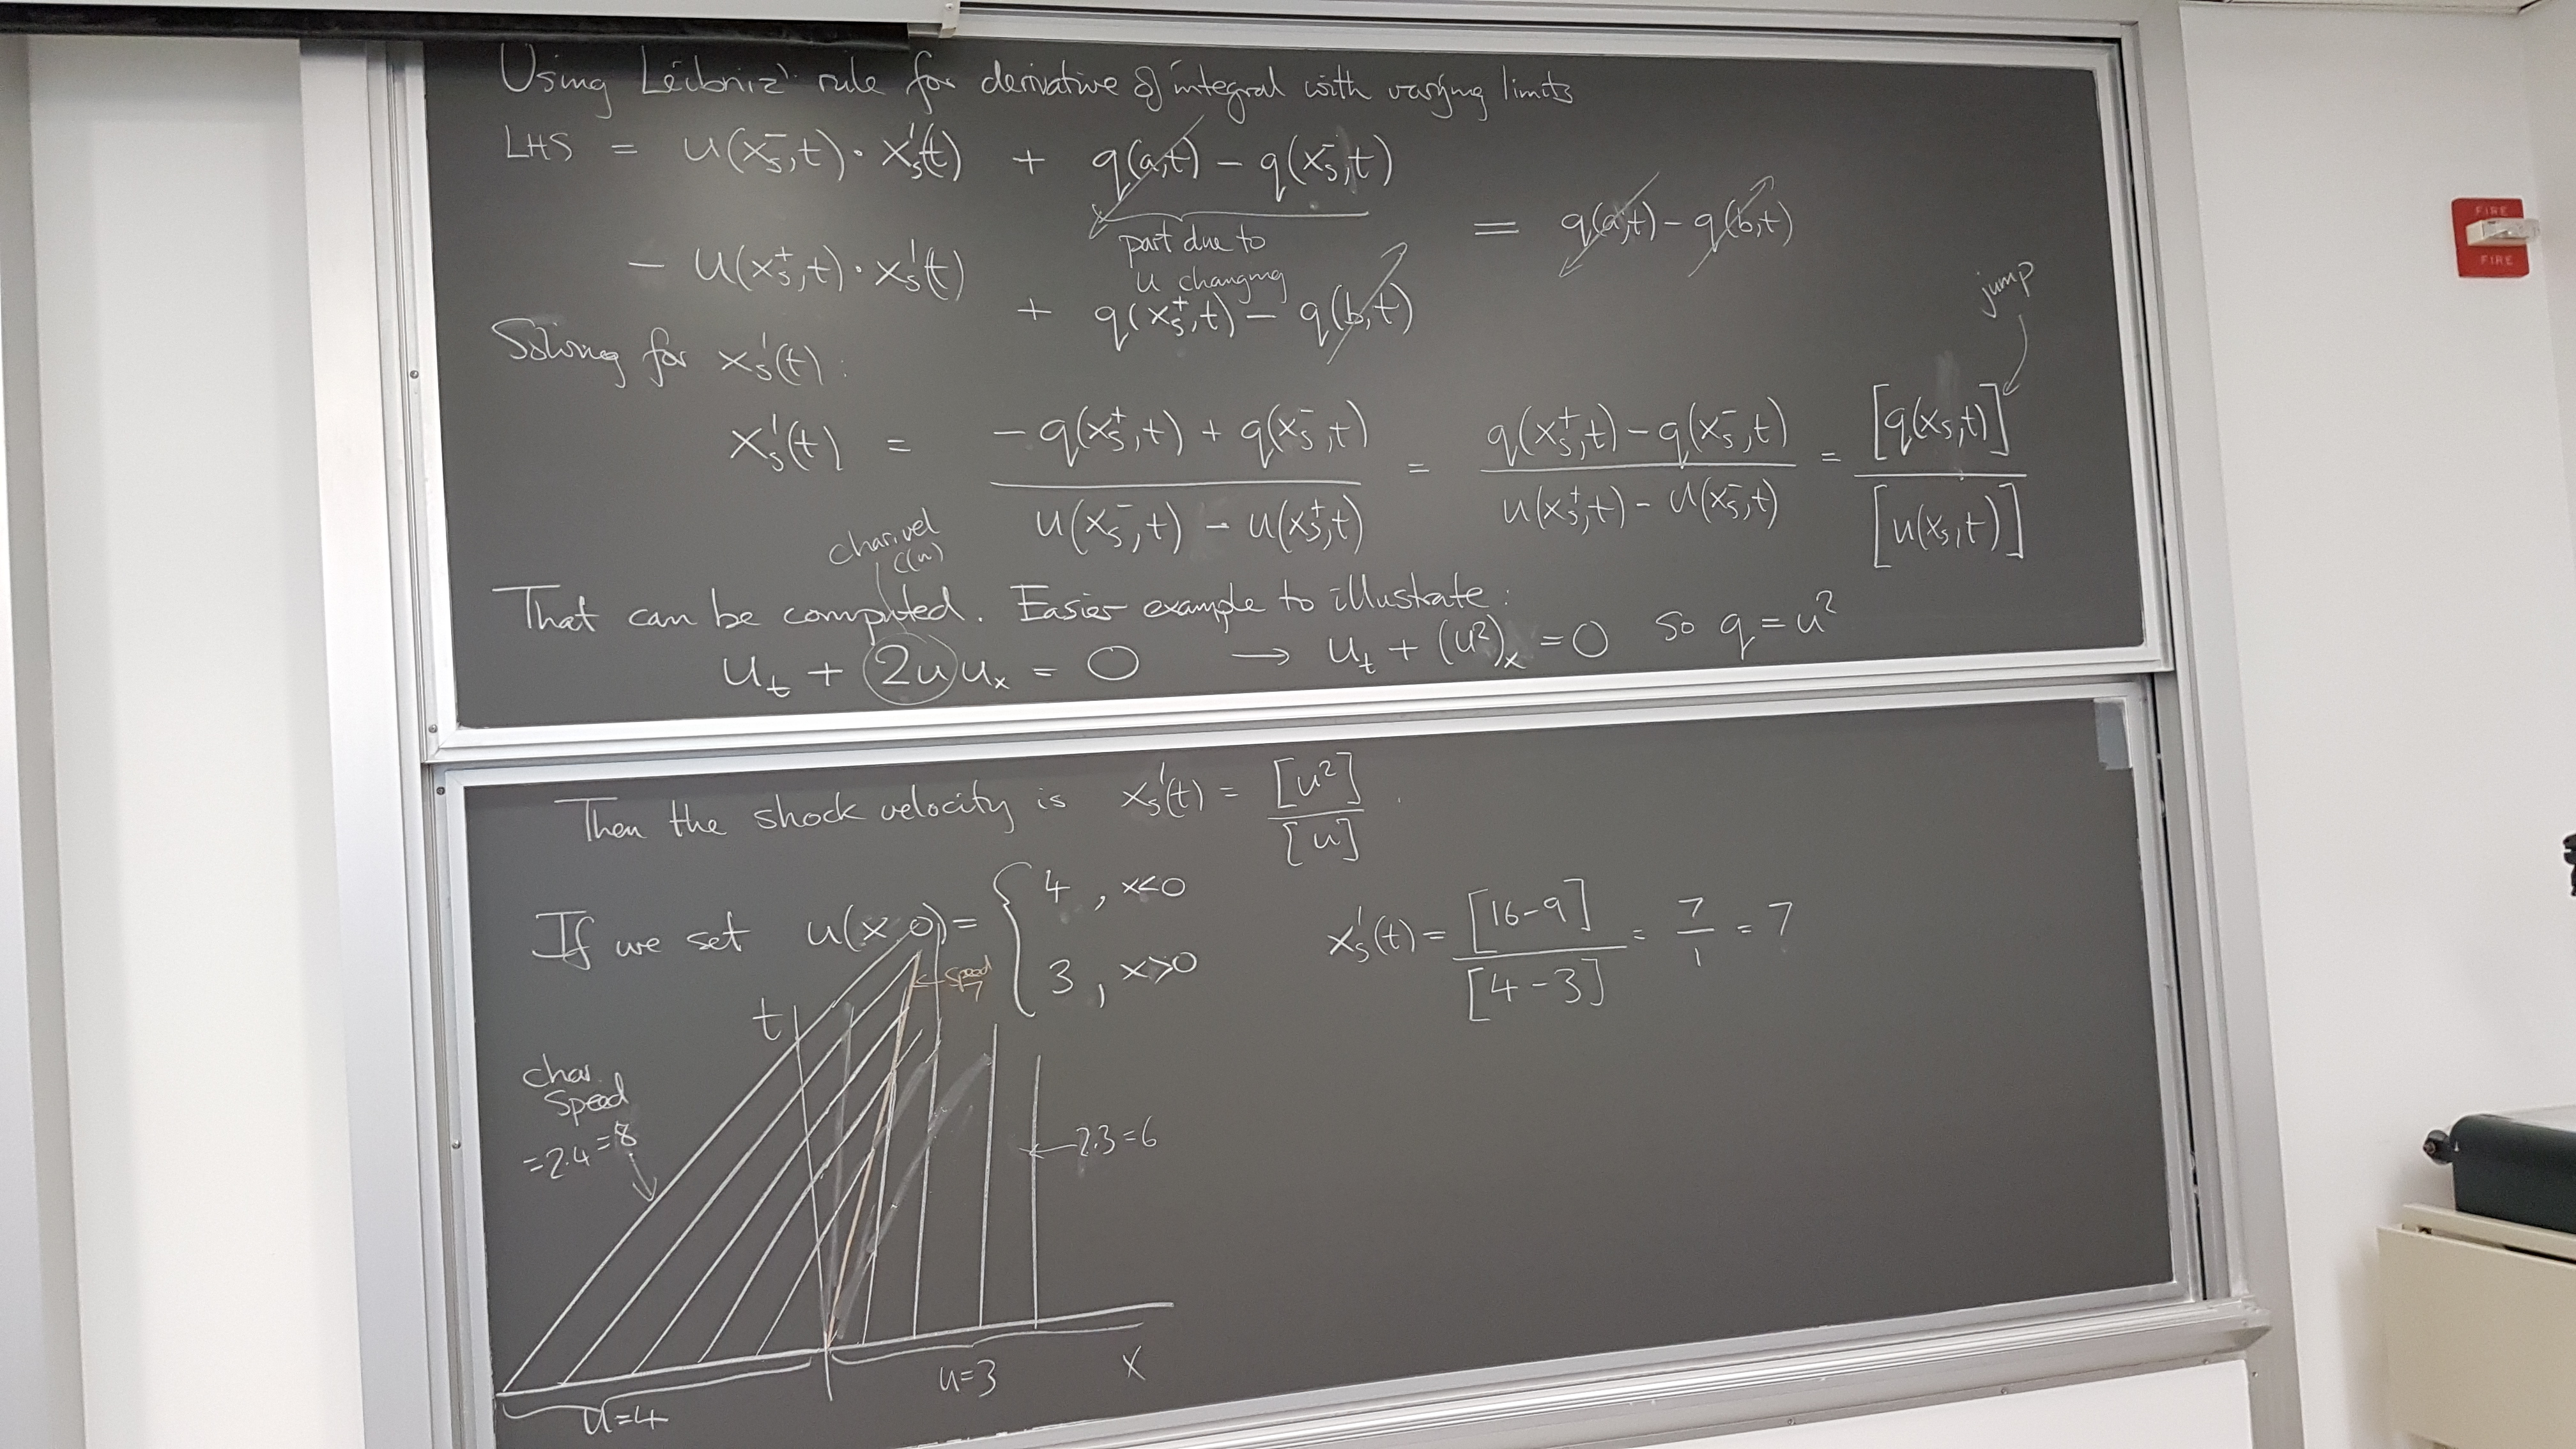
Shocks (discontinuity of u along a curve)
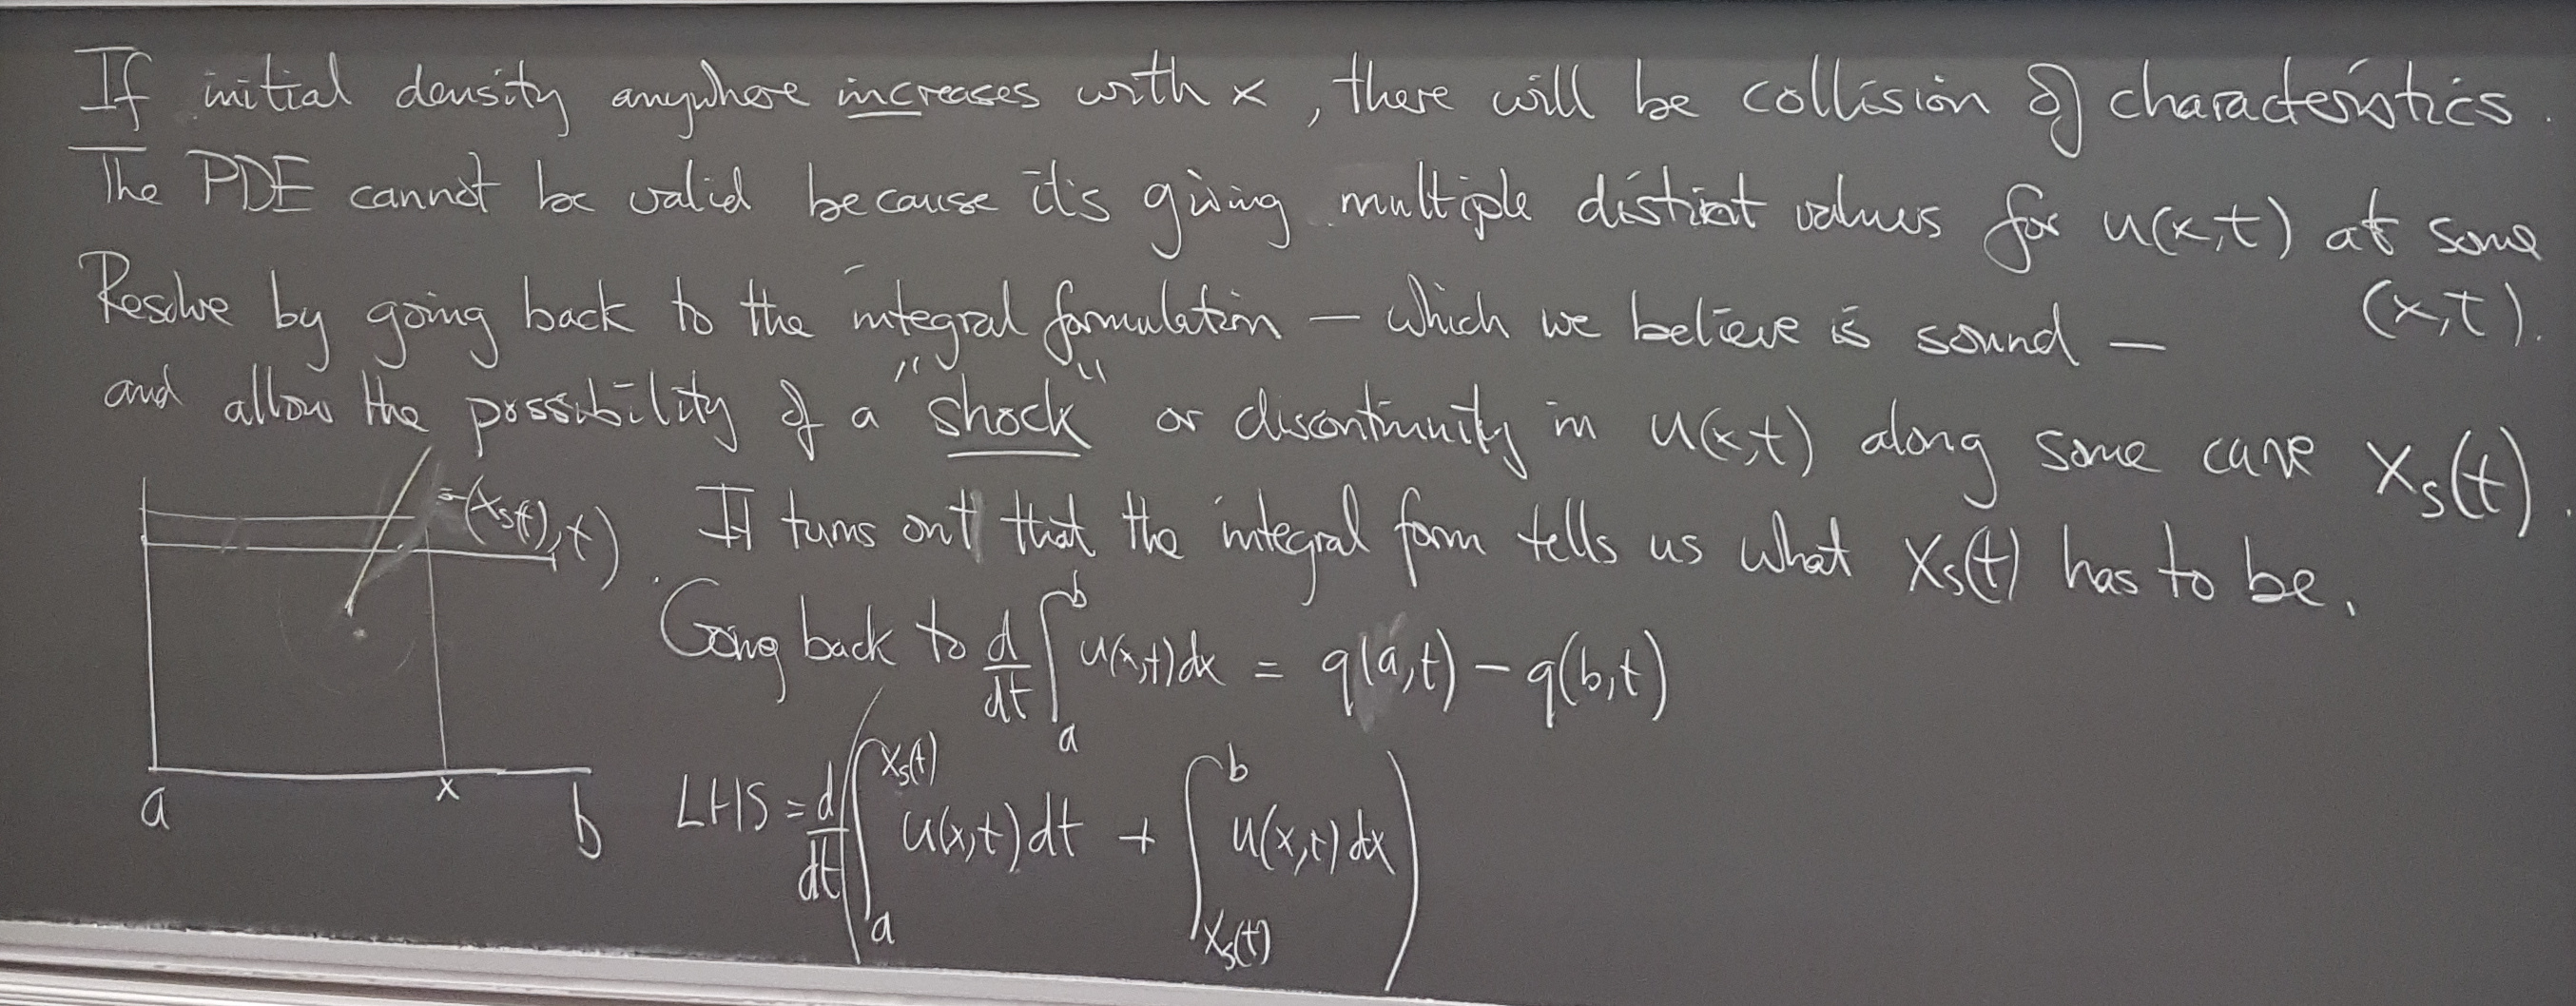
Jump condition:
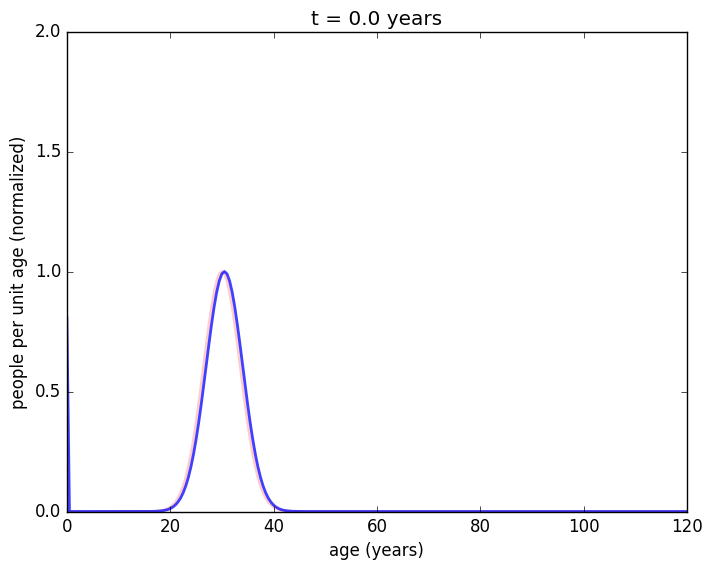
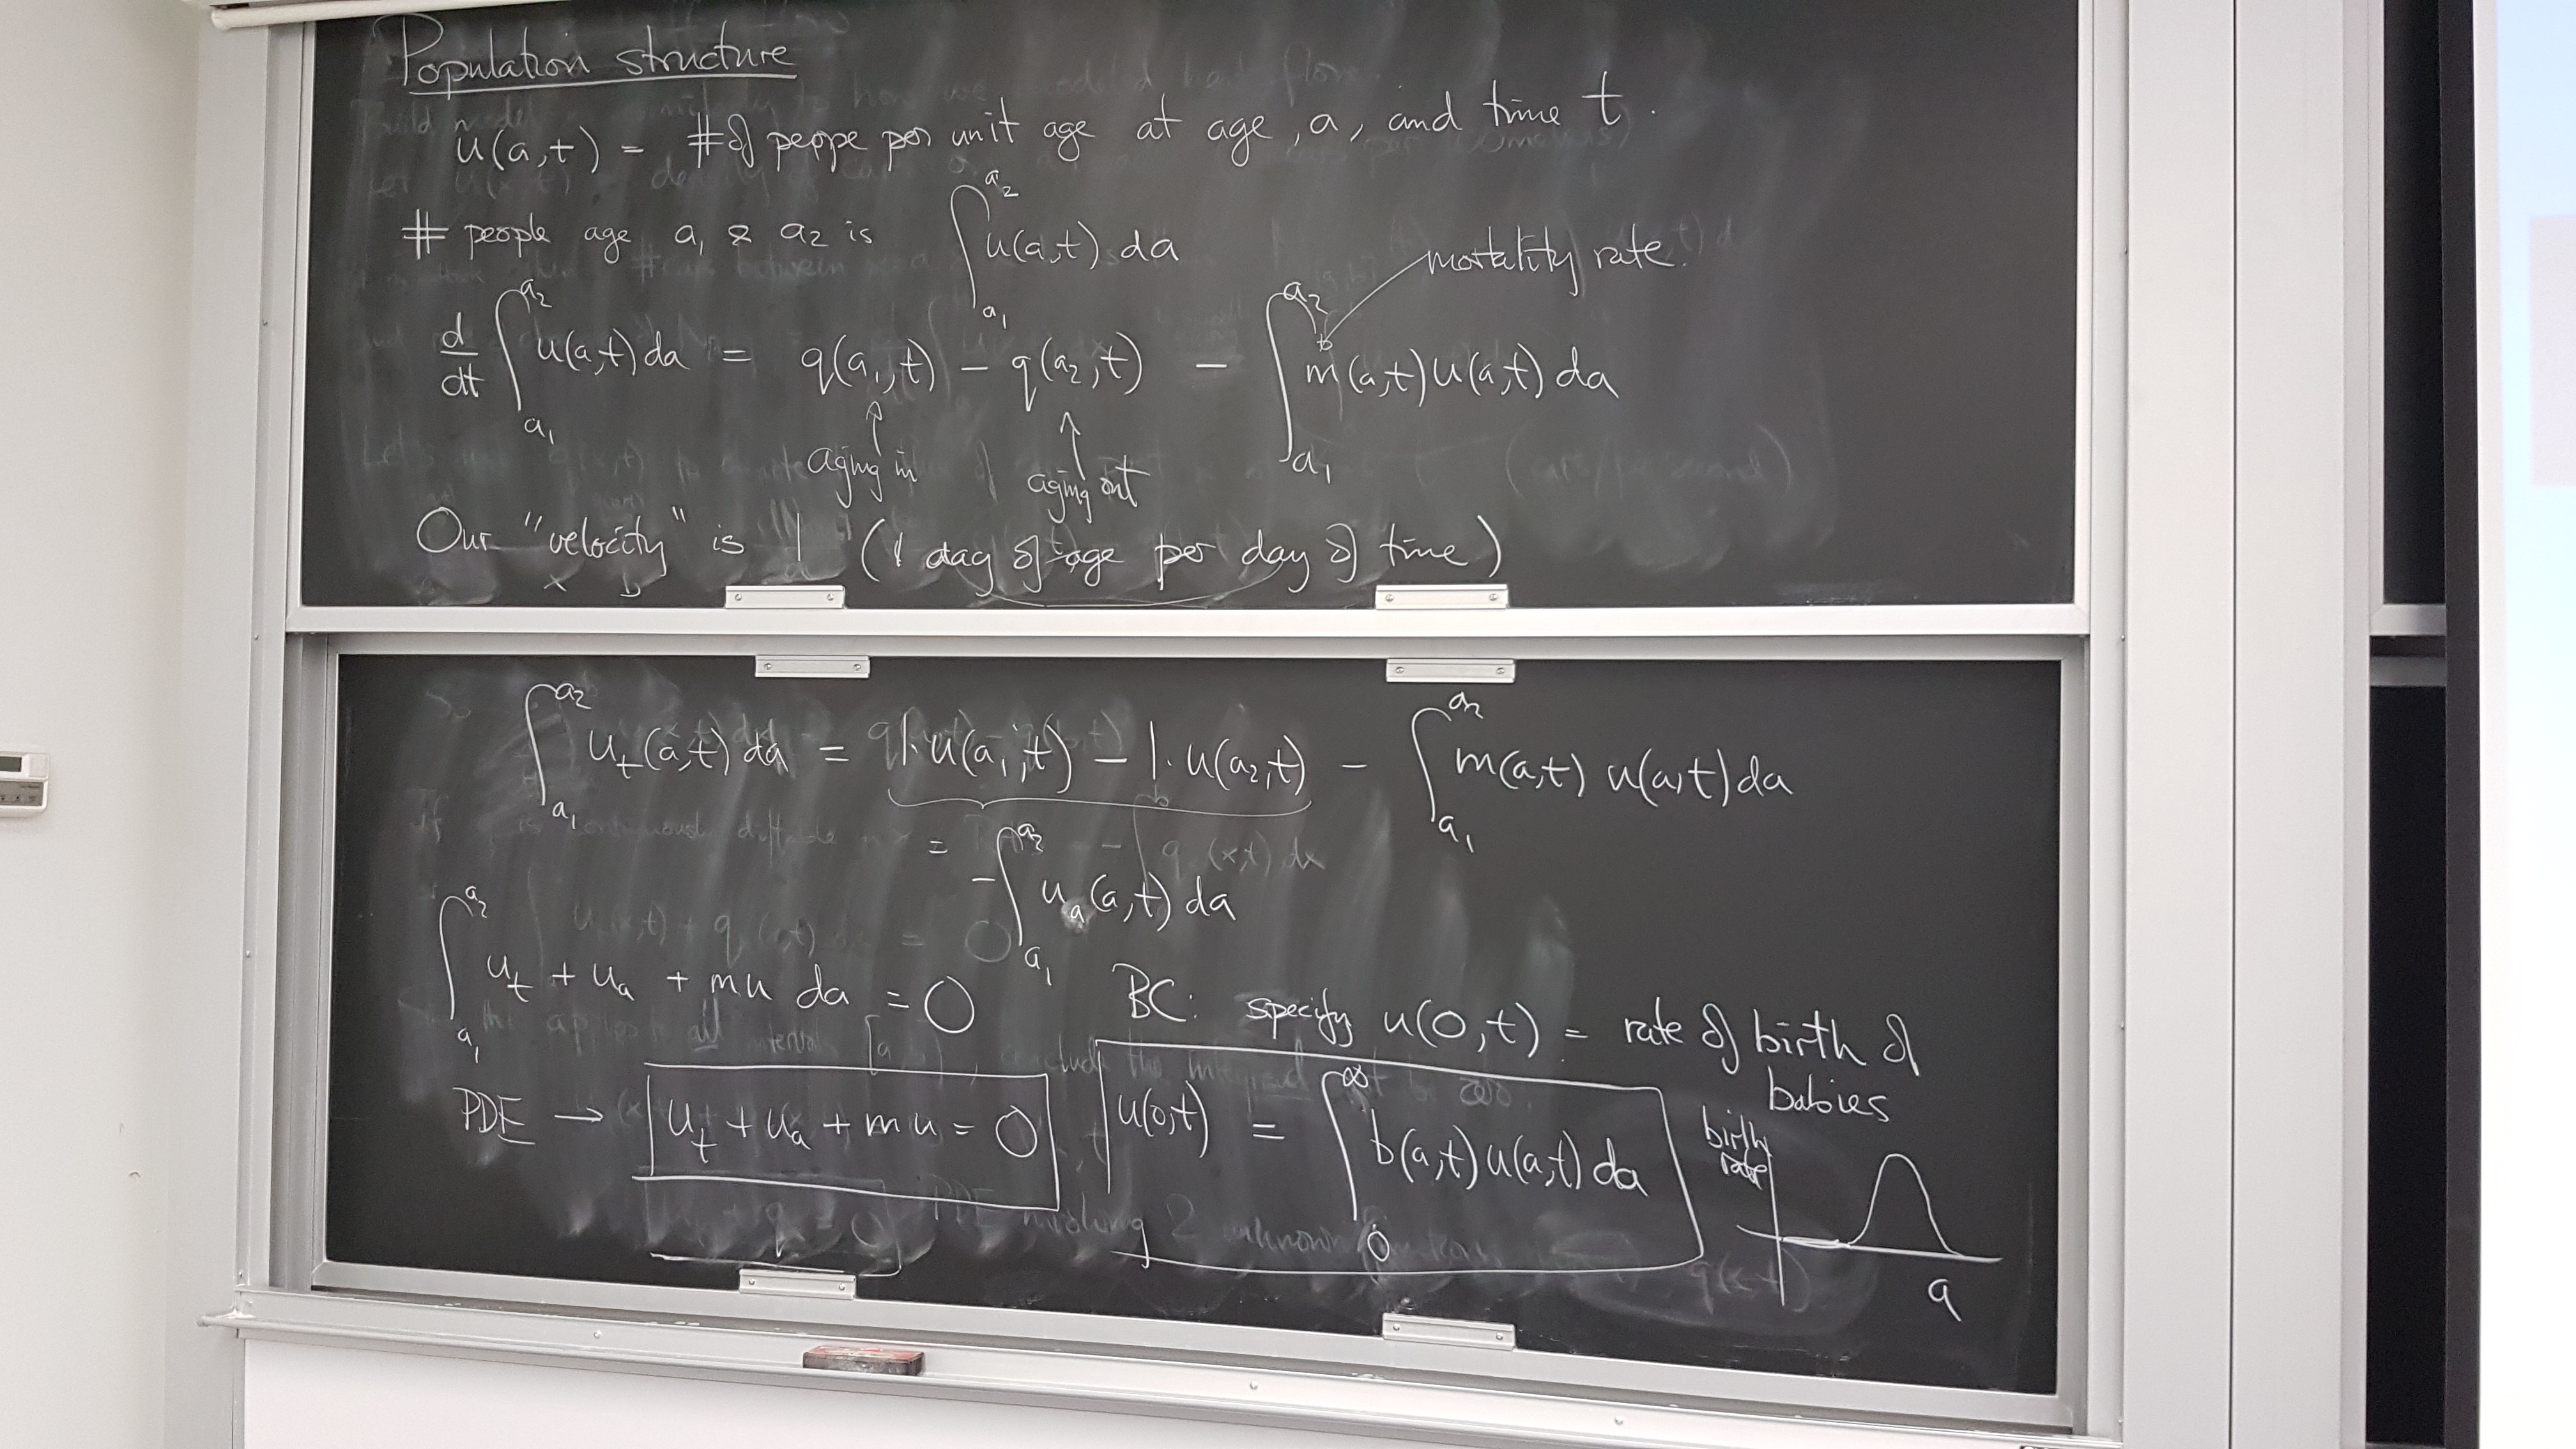
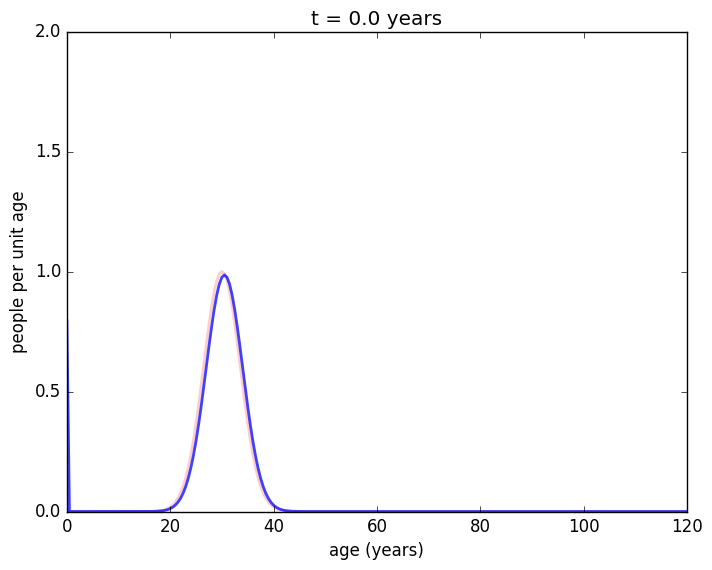
A population age-profile model
Here is an animation (If not moving, try Firefox.):
If we scale the population at each moment of time so that the maxiumum is always 1, we can see how the shape of the population age profile settles to steady state: