Plotting slope fields and using them to solve IVPs
(1) Start up Jupyter Notebook and open a new Python3 notebook.
(2) Import the resources306 module:
from resources306 import *
(3) Create a slope field plot for the differential equation
over the region where t runs from 0 to 5 and y runs from -1 to 5.
Here's code similar to what I showed you in class for a different DE, dy/dx = (y-x)/4:
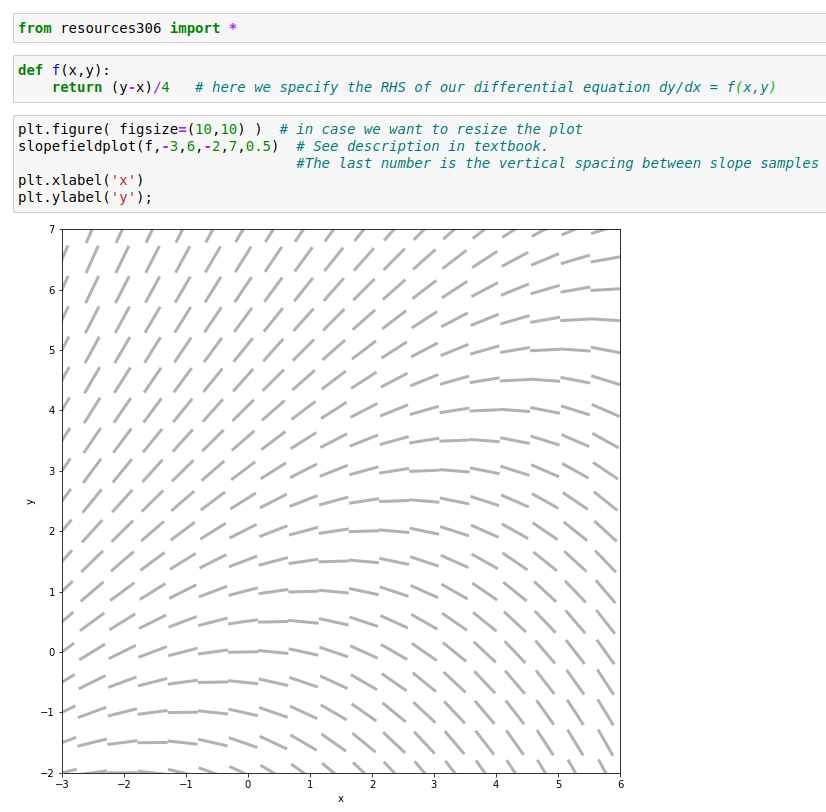
Notes:
(4) Once you have obtained a satisfactory correct slope field picture, ask the TA to check it and give you a printed copy of the slope field.
(5) On the printed slope field, sketch a curve with the following properties:
- it starts at t = 0, y = 0,
- its slope agrees with the slope field at every point along it.
(6) From your picture, estimate as accurately as you can y(4) if the function y(t) satisfies
y(0) = 0 and (dy)/(dt) = cosy + ysint
for all t between 0 and 4. Annotate your picture to show how you got your estimate. Take a photo of your work for your own future reference.
(7) Have the TA check the correctness of your work.