MTH 306 Second Projects Spring 2024
Contents
These are non-trivial projects. It is expected that you will need to consult with me about them.
Project Diary
In addition to collaborating with your teammates on writing the team's Report, you must individually keep - in real time, not retrospectively - a careful diary of the time you spend and the work you do on the project. Each entry should have date, start time, end time, what you did, who you did it with. You will turn this in separately from your report. This is your own private individual work. It will therefore look substantially different from any of your teammates' diaries. I recommend you do not look at anyone else's diary, nor show your diary to anyone else.
Mention of specifical theoretical or technical details you are grappling with will help persuade me that you were fully involved in the project.
Instructions for writing your Report
When you write your report, imagine your are writing to a classmate who is familiar with the course material, but has no specific knowledge of your topic. Use carefully labeled and described illustrations if and where appropriate. Write as clearly as you can, in complete and grammatically correct sentences (including those sentences that contain equations, software commands, etc.). Use a spell-checker if you have any doubt about your spelling, and especially if I suggested it in my comments on your first project.
Everything should be done (or at least compiled) in a Jupyter Notebook that one of the team members will submit to UBlearns.
Required sections
Introduction
Set the stage for your reader. Briefly describe what your project is about. State the goal of your project.
Derivation and description of the model
Describe the system of differential equations you will be studying, including what all the dependent variables and parameters represent. Discuss who invented them, and what ideas they embody.
Method of solution
Briefly describe your numerical method of solving the differential equations.
What the model predicts
Display (graphically) and describe your numerical solutions of the differential equation model, and also what the solutions mean. If there was trial and error involved, either with choosing initial conditions or parameters, or with modifying the differential equations themselves, describe this process.
Conclusions
Summarize the things you have learned about your subject matter using your model. Describe any shortcomings of the model that are apparent to you, and if appropriate say how the model could be improved.
Cautions
Don't fake anything! You can get an A for a carefully done project even if the results are not as anticipated.
Every picture and graph must be properly integrated into the report.
The report should be structured so that it can be read straight through without scrolling back and forth.
While some division of labor among teammates is ok, every team member must eventually fully understand every aspect of the report, and be prepared to answer any question about it in an oral exam.
GET HELP EARLY IF YOU NEED IT!
Option 1. Spacecraft navigation
In a scene in the movie Apollo 13, the actor Ed Harris playing NASA Flight Director Ed Kranz draws a trajectory on a chalkboard like the one shown below, and says it's the way for the damaged spacecraft to return home. Is there really such a figure-of-8 trajectory that leaves the Earth, orbits the Moon, and returns to the Earth at a grazing angle?
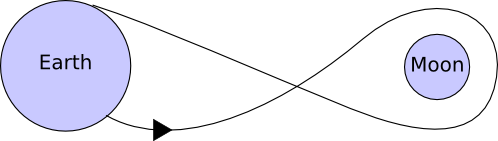
See if you can find one, and discover how fast the spacecraft has to be going when it leaves the Earth, and how long it takes to get back.
You will have to look up the current best estimates of: the masses of the Earth and the Moon, the average distance between the Earth and the Moon, the universal gravitational constant, G, and the radii of the Earth and Moon. Just to keep things interesting for me, let's pretend the Moon's mass is 5% greater than it actually is.
To keep things manageable, assume all 3 objects are in the same plane, and that the Earth and the Moon are fixed. Then the system has 4 dependent variables, x,y,u,v, where (x,y) is the position of the spacecraft, and (u,v) is its velocity.
I would warm up on the simpler problem of a spacecraft orbiting the Earth alone. For example, you could reproduce this famous sketch by Isaaac Newton, which shows how a projectile launched from a mountaintop with increasing velocity would eventually attain orbit:
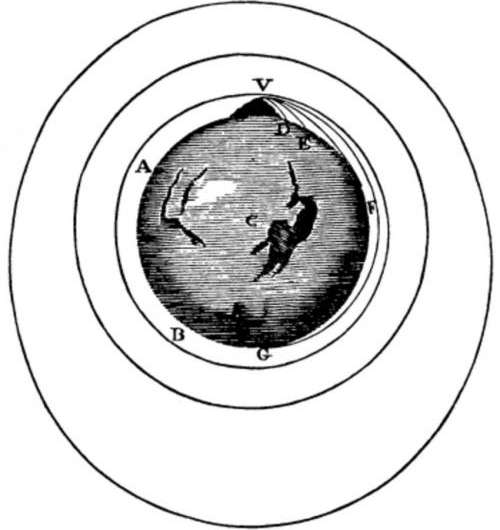
Don't forget to put the Earth in your picture. Then once that's working, add in the Moon.
Here's how you can draw disks with matplotlib:
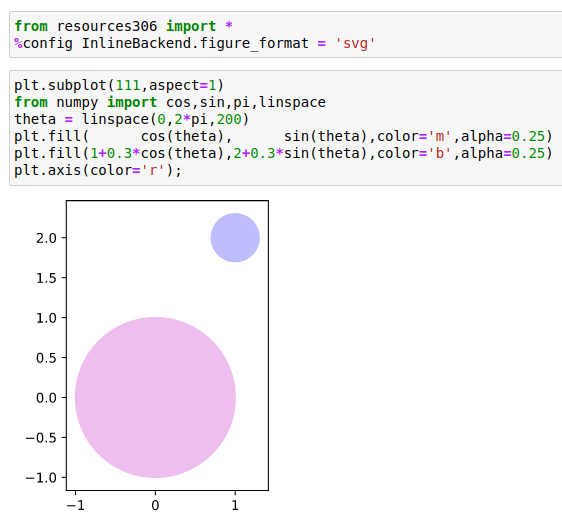
from resources306 import *
%config InlineBackend.figure_format = 'retina'
plt.subplot(111,aspect=1)
from numpy import cos,sin,pi,linspace
theta = linspace(0,2*pi,200)
plt.fill(      cos(theta),      sin(theta),color='m',alpha=0.25)
plt.fill(1+0.3*cos(theta),2+0.3*sin(theta),color='b',alpha=0.25)
plt.axis(color='r');
The laws of motion for the spacecraft are (Newton's 2nd Law):
(dX)/(dt) = V, (dV)/(dt) = (F)/(m),
where X is the spacecraft's position vector, V is its velocity vector, m is its mass, and the total force acting on it is (by Newton's Law of Gravitation)
where N is the number of bodies pulling on it, mi is the mass of the ith such body and Xi is its position vector, and |.| denotes the length of a vector.
You may use Euler's method, or the Improved Euler method (see our textbook) which can give you more accuracy with the same time-step. Either way, be sure you choose your time-step appropriately.
You may find it easier to control your spacecraft if you set things up so that you specify the launch speed and angle of your spacecraft, rather than directly specifying the 2 components of its velocity.
Option 2. Viral infection dynamics
In the early days of the HIV epidemic, before effective treatments were developed, people infected often seemed to be clearing the virus at first, only to succumb to it later.
This paper by Andrew Phillips claimed to explain the potentially misleading initial drop in HIV virus levels in the blood during acute infection.
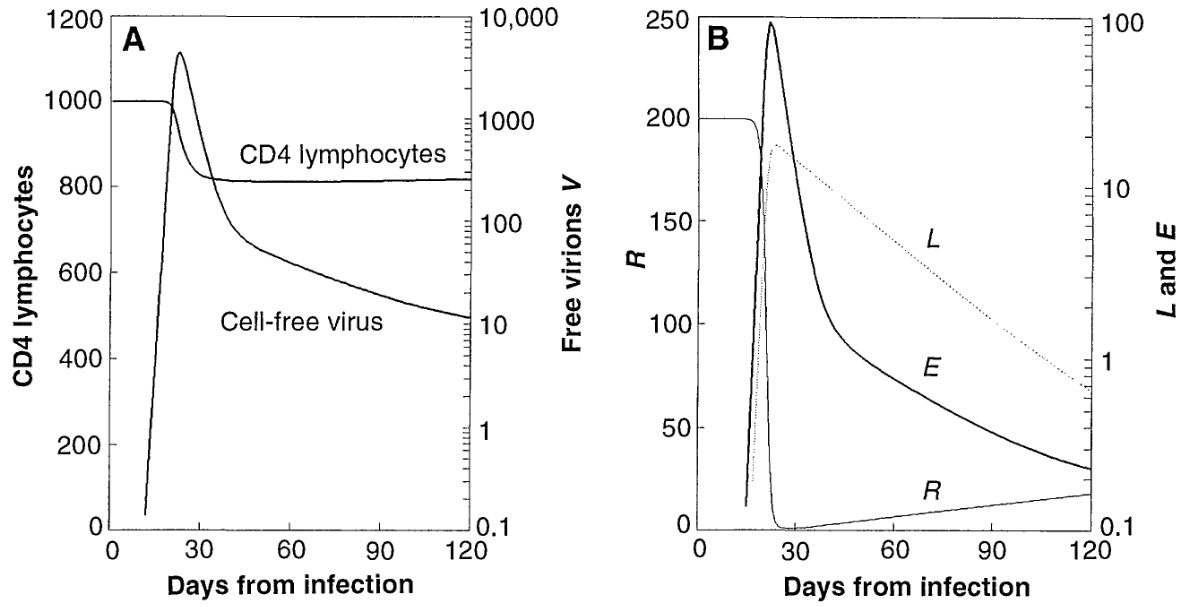
Write a report that shows that the author's solved his model correctly (or incorrectly!) by attempting to reproduce very carefully the graphs in Figure 1. You will need to use a numerical method, and you may use Euler's, or the Improved Euler method (consult our textbook) which can give you more accuracy than Euler for the same step-size. Either way, make sure your step-size is small enough by halving the step-size until the answer doesn't change appreciably. Make the shapes and scales of your graphs exactly the same as in the paper: note that some of them use a logarithmic scale.
Figuring out what parameter values and initial conditions the author used for Figure 1 will require some careful reading.
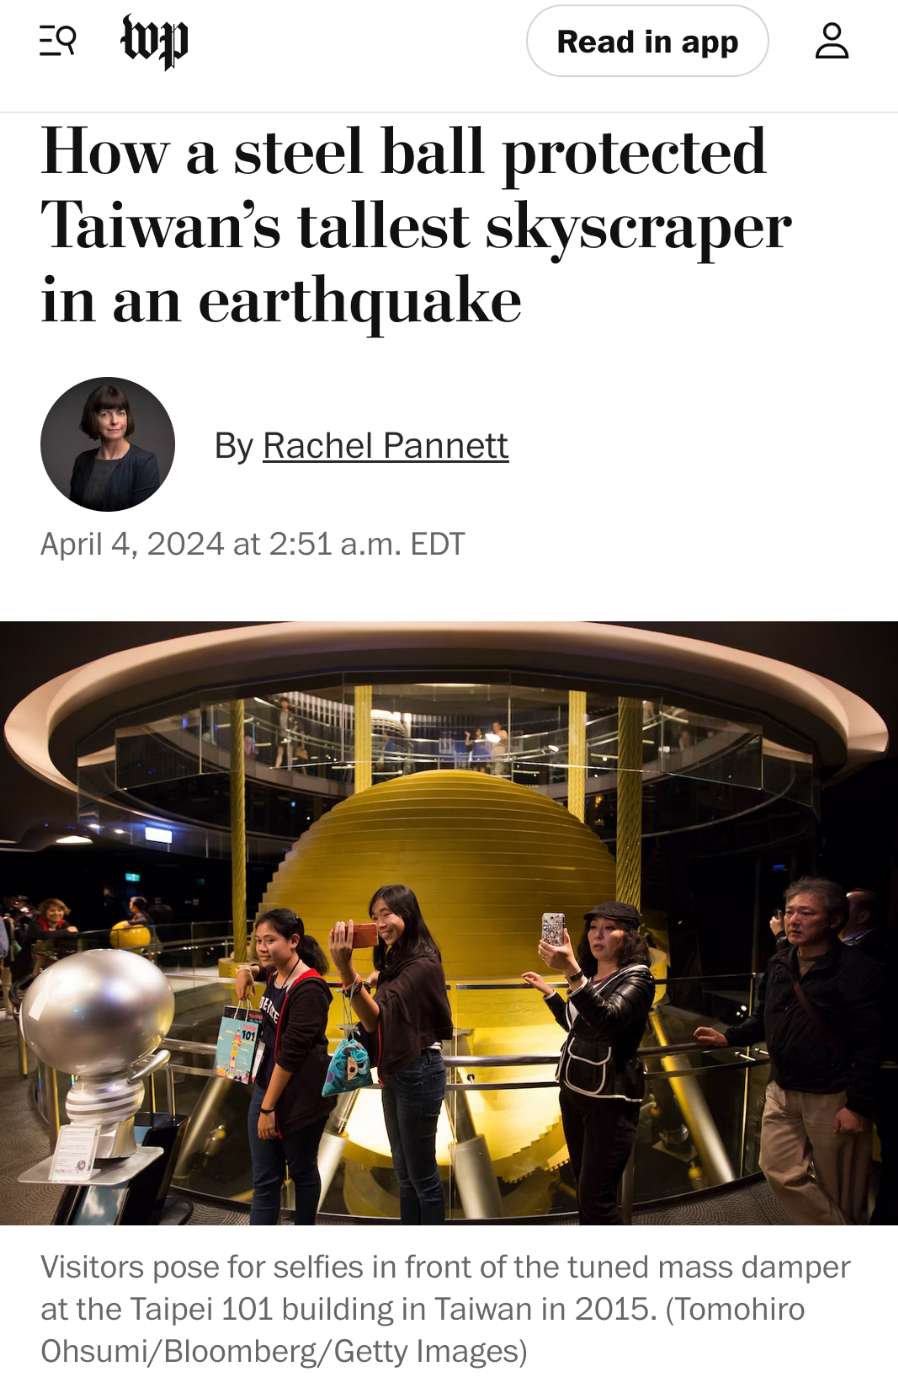
Option 3. Taipei 101
Buildings in Taiwan are subject to high winds from typhoons and frequent earthquakes. The skyscraper Taipei 101 has a motion-damping system, called a tuned mass damper, consisting of a heavy damped pendulum suspended near the top of the building. The "tuning" is to make the oscillatory frequency of the pendulum close to the primary oscillation frequency of the building. Reportedly, this causes the pendulum to suck energy out of the building's oscillation when it gets kicked by the wind or an earthquake, reducing discomfort to its occupants.
The task of this project is to explore a model of the building and the tuned mass damper and confirm (or challenge) the belief that the system should work as advertised.
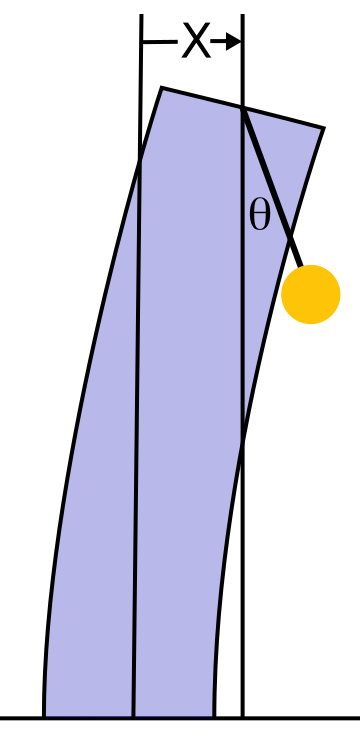
According to my calculations, the displacement X of the top of the building and the displacement x of the pendulum ball relative to the top of the building, at time t, will approximately satisfy the following equations, which I obtained by applying Newton's 2nd Law of motion to the building and the pendulum:
(d2X)/(dt2) = − KX − C(dX)/(dt) + μ(kx + c(dx)/(dt))
(d2x)/(dt2) = − kx − c(dx)/(dt) − (d2X)/(dt2)
Note the distinction between upper-case letters for the building an lower-case for the ball.
You'll need to convert these to an equivalent system of four 1st order differential equations to faciltate numerical solution. The parameters are as follows
| symbol | value | description |
|---|---|---|
| μ | 0.01 suggested | mass of ball relative to effective mass of building |
| C | 0.01 suggested | intrinsic damping coefficient of building relative to its mass |
| K | 1 | spring constant of building relative to its effective mass |
| k | around K suggested | effective spring constant of ball relative to its mass |
| c | ? | damping coefficient of ball relative to its mass (find optimal) |
Your job is to tune the parameters k and c so as to obtain the most rapid damping of the building oscillations.
You should compute and plot the response of the building (and the ball) to an impulsive kick: X(0) = 0, X’(0) = 1, x’(0) = 0, x’(0) = − X’(0). (That initial condition on x’ makes the ball initially at rest relative to the ground.), comparing what happens with and without the damper present.
You will need to develop a measure of how fast the motion of the building is decaying that you can apply to your numerical solutions.
There are various ways to remove the effect of the damper. One is to simply write a simplified system for the building alone. Another might be to make the damping coefficient c very large so that the damper is essentially rigidily attached to the building.
One specific goal is to find values of the damper's parameters that maximize its beneficial effect. You will observe, and should demonstrate in your report, that if the pendulum frequency is not well-matched to that of the building, or if the damping is too strong or too weak, the damper's effect will be small.
To illuminate the situation, you might also consider computing the eigevalues and eigenvectors of the linearization of the system at the equilibrium X = x = X’ = x’ = 0.
Option 4. Traffic dynamics
Traffic jams are often caused by accidents, but you may have noticed that even on an accident-free straight highway, traffic can slow - or even come to a standstill - for no apparent reason: I've seen this many times while driving on the QEW between Buffalo and Toronto. Can we understand this phenomenon by modeling it?
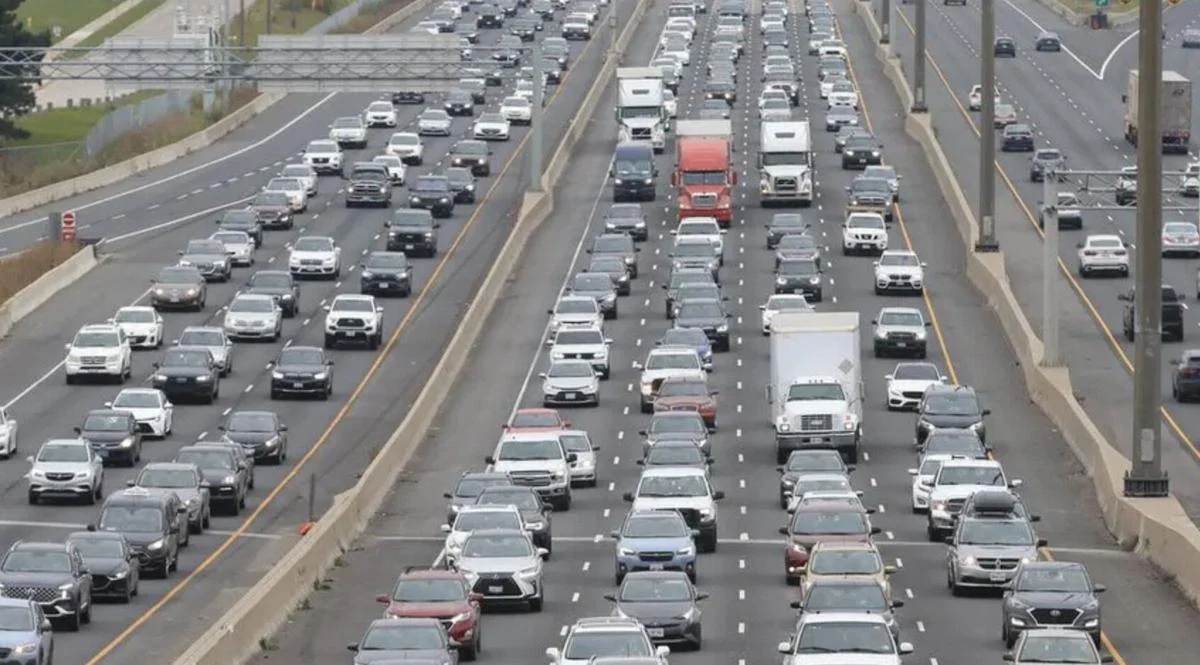
For simplicity in modeling, let's imagine a one-lane road where cars cannot pass one another. The front-most driver can do what they like - they're not constrained by other cars. One choice would be to drive at a constant speed. The other drivers will adjust to the what they see ahead of them.
Let xi(t), i = 0..N be the positions of N+1 consecutive cars on this road.
1 Come up with a sensible model of how xi(t) might change in time. What does the driver actually control? How do current conditions determine what the driver does in terms of altering speed? It is likely your model will be a system of N 2nd order differential equations, that should be converted to an equivalent system of 2N 1st order differential equations to faciltate numerical solution.
2 See what the consequences of your model are by numerically solving your model for some appropriate initial conditions. Display your results by making some plots. Investigate how the movement of the cars changes when you adjust some parameters of your model.